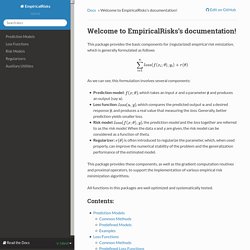

Distributionsjl. Welcome to EmpiricalRisks’s documentation! — EmpiricalRisks 0.2.3 documentation. This package provides the basic components for (regularized) empirical risk minization, which is generally formulated as follows As we can see, this formulation involves several components: Prediction model: , which takes an input and a parameter and produces an output (say ).Loss function: , which compares the predicted output and a desired response , and produces a real value that measuring the loss.

Generally, better prediction yields smaller loss.Risk model: , the prediction model and the loss together are referred to as the risk model. When the data x and y are given, the risk model can be considered as a function of theta.Regularizer: is often introduced to regularize the parameter, which, when used properly, can improve the numerical stability of the problem and the generalization performance of the estimated model.
All functions in this packages are well optimized and systematically tested. Titanic with Julia - Of Data Monsters. This is an introduction to Data Analysis and Decision Trees using Julia.

In this tutorial we will explore how to tackle Kaggle’s Titanic competition using Julia and Machine Learning. This tutorial is adopted from the Kaggle R tutorial on Machine Learning on Datacamp In case you’re new to Julia, you can read more about its awesomeness on julialang.org. Again, the point of this tutorial is not to teach machine learning but to provide a starting point to get your hands dirty with Julia code. The benchmark numbers on the Julia website look pretty impressive. So get ready to embrace Julia with a warm hug! Let’s get started. We start with loading the dataset from the Titanic Competition from kaggle. Using DataFrames train = readtable("data/train.csv") head(train) test = readtable("data/test.csv") head(test) size(train, 1) 891 Let’s take a closer look at our datasets. describe() helps us to summarize the entire dataset.
Getting Started — dataframesjl 0.6.0 documentation. Installation The DataFrames package is available through the Julia package system.

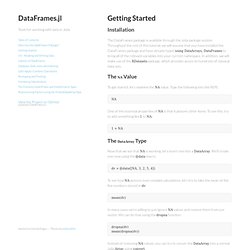
Throughout the rest of this tutorial, we will assume that you have installed the DataFrames package and have already typed using DataArrays, DataFrames to bring all of the relevant variables into your current namespace. In addition, we will make use of the RDatasets package, which provides access to hundreds of classical data sets. The NA Value¶ To get started, let’s examine the NA value. One of the essential properties of NA is that it poisons other items. The DataArray Type¶ Now that we see that NA is working, let’s insert one into a DataArray.
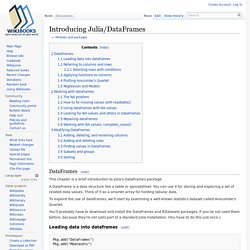
Dv = @data([NA, 3, 2, 5, 4]) To see how NA poisons even complex calculations, let’s try to take the mean of the five numbers stored in dv: In many cases we’re willing to just ignore NA values and remove them from our vector. Introducing Julia/DataFrames. DataFrames[edit] This chapter is a brief introduction to Julia's DataFrames package.

A DataFrame is a data structure like a table or spreadsheet. You can use it for storing and exploring a set of related data values. Think of it as a smarter array for holding tabular data. To explore the use of dataframes, we'll start by examining a well-known statistics dataset called Anscombe's Quartet. You'll probably have to download and install the DataFrames and RDatasets packages, if you've not used them before, because they're not (yet) part of a standard Julia installation. Loading data into dataframes[edit] Pkg.add("DataFrames") Pkg.add("RDatasets") Overall roadmap · Issue #1 · JuliaStats/Roadmap.jl. Manual. Statistical Models in Julia (Doug Bates) Julia Statistics. Slides. Tabular Data I/O in Julia. Importing tabular data into Julia can be done in (at least) three ways: reading a delimited file into an array, reading a delimited file into a DataFrame and accessing databases using ODBC.

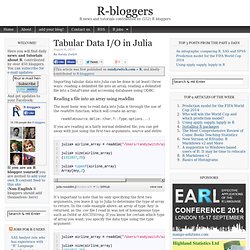
Reading a file into an array using readdlm The most basic way to read data into Julia is through the use of the readdlm function, which will create an array: readdlm(source, delim::Char, T::Type; options...) If you are reading in a fairly normal delimited file, you can get away with just using the first two arguments, source and delim: It’s important to note that by only specifying the first two arguments, you leave it up to Julia to determine the type of array to return. It’s probably the case that unless you are looking to do linear algebra or other specific mathy type work, you’ll likely find that reading your data into a DataFrame will be more comfortable to work with (especially if you are coming from an R, Python/pandas or even spreadsheet tradition). writedlm(filename, array, delim::Char) Summary.
Tools for working with data in Julia. Installation The DataFrames package is available through the Julia package system.

Throughout the rest of this tutorial, we will assume that you have installed the DataFrames package and have already typed using DataArrays, DataFrames to bring all of the relevant variables into your current namespace. In addition, we will make use of the RDatasets package, which provides access to hundreds of classical data sets.