
Using R to Test Pairs of Securities for Cointegration. Ernie Chan's book , Quantitative Trading , explains why cointegrated pairs of securities are useful for constructing mean-reverting trades.
It also explains how to test pairs of securities for cointegration. Ernie uses Matlab, but some readers may want to use R , the software for statistical computing and graphics. This note explains how to perform the cointegration test using R. Let's assume you have the history of daily prices for two stocks, GLD and GDX . You want to know if the prices are cointegrated. Examples. If there was one area of R that was a bit lacking, it was the ability to visualize financial data with standard financial charting tools.

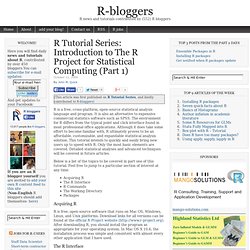
By virtue of no other package implementing this, quantmod took up the call and took a shot at providing a solution. What started with a single OHLC charting solution has grown into a highly configurable and dynamic charting facility as of version 0.3-4, with more coolness slated for 0.4-0 and beyond. For now, let's take a look at what its currently in place: Financial Charts in quantmod: Most of the charting functionality is designed to be used interactively. Let's get charting! Introducing chartSeries chartSeries is the main function doing all the work in quantmod. By default any series that is.OHLC is charted as an OHLC series. The default choice ['auto'] lets the software decide, candles where they'd be visible clearly, matchsticks if many points are being charted, and lines if the series isn't of an OHLC nature. > # the whole series > chartSeries(GS) R Tutorial Series: Introduction to The R Project for Statistical Computing (Part 1)
R is a free, cross-platform, open-source statistical analysis language and program.
It is also an alternative to expensive commercial statistics software such as SPSS. The environment for R differs from the typical point and click interface found in most professional office applications. Although it does take some effort to become familiar with, R ultimately proves to be an affordable, customizable, and expandable statistical analysis solution. Wald-Wolfowitz Test on the Line. Estimating the Hurst Exponent. Why is the Hurst Exponent Interesting?
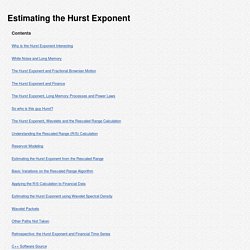
The Hurst exponent occurs in several areas of applied mathematics, including fractals and chaos theory, long memory processes and spectral analysis. Hurst exponent estimation has been applied in areas ranging from biophysics to computer networking. Estimation of the Hurst exponent was originally developed in hydrology. However, the modern techniques for estimating the Hurst exponent comes from fractal mathematics. The mathematics and images derived from fractal geometry exploded into the world the 1970s and 1980s. Figure 1, a self-similar four sided Sierpinski pyramid (Click on the image for a larger version) From the Sierpinski Pyramid web page on bearcave.com.
The Hurst Exponent and Technical Analysis. A Generalized Approach to Portfolio Optimization. R code for estimating Hurst exponent. 33092 - Wald-Wolfowitz (or Runs) test for randomness. The Wald-Wolfowitz test, also known as the Runs test for randomness, is used to test the hypothesis that a series of numbers is random.
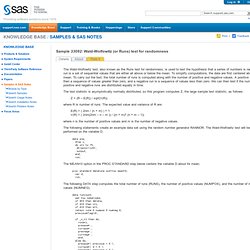
A run is a set of sequential values that are either all above or below the mean. To simplify computations, the data are first centered about their mean. To carry out the test, the total number of runs is computed along with the number of positive and negative values. A positive run is then a sequence of values greater than zero, and a negative run is a sequence of values less than zero.
We can then test if the number of positive and negative runs are distributed equally in time. The test statistic is asymptotically normally distributed, so this program computes Z, the large sample test statistic, as follows: Books and Tutorials. Cluster Analysis. R has an amazing variety of functions for cluster analysis.
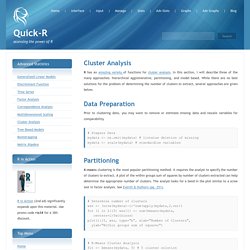
In this section, I will describe three of the many approaches: hierarchical agglomerative, partitioning, and model based. While there are no best solutions for the problem of determining the number of clusters to extract, several approaches are given below. Data Preparation Prior to clustering data, you may want to remove or estimate missing data and rescale variables for comparability. # Prepare Data mydata <- na.omit(mydata) # listwise deletion of missing mydata <- scale(mydata) # standardize variables Partitioning K-means clustering is the most popular partitioning method.
. # Determine number of clusters wss <- (nrow(mydata)-1)*sum(apply(mydata,2,var)) for (i in 2:15) wss[i] <- sum(kmeans(mydata, centers=i)$withinss) plot(1:15, wss, type="b", xlab="Number of Clusters", ylab="Within groups sum of squares") Integrate R-Based Analytics Across the Web or Enterprise with Revolution R Enterprise. Revolution R Enterprise excels at unlocking knowledge, including trends, behaviors, predictions and even outliers inside enterprise data.
DeployR is designed to deliver that knowledge securely and at scale to whomever needs it: inside or outside the enterprise. By providing a seamless, secure, data bridge between analytics solutions and enterprise software, DeployR solves a key integration problem faced by businesses adopting R based analytics alongside existing IT infrastructure.
Data scientists typically focus on developing analytics solutions using software tools on their workbench. Using DeployR, these solutions can now be leveraged by your business far beyond those workbenches. The DeployR server can expose any R based analytics solution as a secure web service. DeployR Benefits Deliver our R Analytics Securely Across the Enterprise Deliver your R Analytics at Scale.