
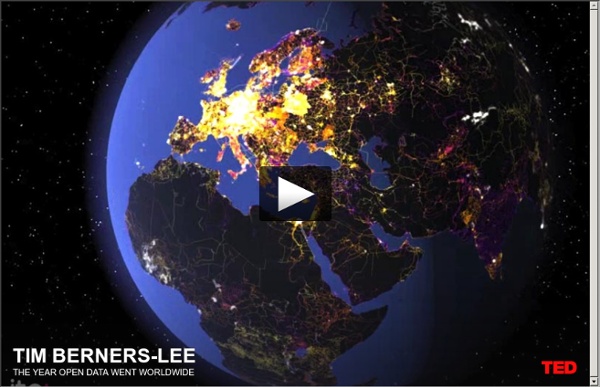
Palantir Tech (palantirtech) ITO World at TED 2010 - Project Haiti We are proud to announce that our work has been displayed at this year's TED conference, where the world's greatest thinkers and doers come together. We were asked to provide visualisations that helped tell the story of open data in 2009, for Sir Tim Berners-Lee to give an update on open data since his talk last year. We chose to tell the story of 'OpenStreetMap - Project Haiti'. We all followed the crisis that unfolded following the Haiti earthquake, many of us chose to donate money, a few were flown out and deployed as part of the relief effort. With the little existing physical, political and social infrastructure now destroyed or damaged, the situation was especially challenging for aid agencies arriving on the ground. Enter OpenStreetMap, the wiki map of the world, CrisisMappers and an impromptu community of volunteers who collaborated to produce the most authoritative map of Haiti in existence. OpenStreetMap - Project Haiti from ItoWorld on Vimeo.
Snake Oil? The scientific evidence for health supplements See the data: bit.ly/snakeoilsupps. See the static versionSee the old flash version Check the evidence for so-called Superfoods visualized. Note: You might see multiple bubbles for certain supplements. These is because some supps affect a range of conditions, but the evidence quality varies from condition to condition. This visualisation generates itself from this Google Doc. As ever, we welcome your thoughts, crits, comments, corrections, compliments, tweaks, new evidence, missing supps, and general feedback. » Purchase: Amazon US or Barnes & Noble | UK or Waterstones » Download: Apple iBook | Kindle (UK & US) » See inside For more graphics, visualisations and data-journalism:
Data.gov Data Driven Journalism transparent map comparison openstreetmap google yahoo Données cartographiques ©2013 - Conditions d'utilisation Base Layer Google Streets Google MapMaker Google Aerial Google Physical Overlays OpenStreetMap Mapnik OSM Mapnik german style OSM Cycle Map ÖPNV Karte Mapquest OSM Hillshading Hiking Map ADFC Bicyclenetwork Map data © OpenStreetMap and contributors CC-BY-SA , NASA SRTM Permalink
Mapping A Crisis | The Guardian Open Platform Confusion reigns in the aftermath of any big natural disaster, but particularly so in what was already a failed state. With the little existing physical, political and social infrastructure there was now destroyed or damaged, the situation was especially challenging for aid agencies arriving on the ground. Where are the areas most in need of assistance? How do we get there? Where are people trapped under buildings? Step up OpenStreetMap, the wiki map of the world, CrisisMappers and an impromptu community of volunteers who collaborated to produce the most authoritative map of Haiti in existence. In the video, each flash represents a new edit into OpenStreetMap, and this visualisation is a vivid picture of how much work was contributed by volunteers, following the quake. The picture above and the quotes below says all that really needs to be said about the power and importance of this technology to aid workers on the ground: Kjeld Jensen, Red Cross (IFRC)
Technology Review: Putting the Web in a Spreadsheet Vast quantities of data are freely available on the Web, and it can be a potential treasure trove for many businesses–providing they can figure out how to use it effectively. A company can, for example, comb through data from the U.S. Patent and Trademark Office and court records prior to acquiring another company to see if any of its intellectual property is tied up in legal action. In practice, however, going through so much information takes time and effort to orchestrate. IBM hopes that a new tool, called BigSheets, will help users analyze Web data more easily. “The ability of any user to do their own types of interesting analytics is coming of age,” says Rod Smith, vice president of emerging Internet technologies for IBM. BigSheets is built on top of another piece of software called Hadoop. BigSheets uses Hadoop to crawl through Web pages, parsing them to extract key terms and other useful data. To use BigSheets, a user would point the tool at a set of URLs or a repository of data.
xWeb This site has been created to foster discussion on how our thinking, learning, and organizational activities are impacted through technology and societal changes. Since the original publication of Connectivism: A Learning Theory for the Digital Age, I've been approached by many people requesting additional thinking and discussion. Four tools are available to provide dialogue: Blog for my personal reflective thoughtsWiki for collaborative content creationDiscussion forums for discussion on issues impacted by a connectivist view of learningEmail list for discussions on technology, networks and learning Most resources on this site are intended for public viewing, but contributing to the wiki or discussion forums requires registration. Please create your account by clicking the "join" text on the top, right-hand corner. If you are interested in general learning and technology trends, please visit my elearnspace site.
كينيا ومولدوفا: دروس للبلدان النامية في البيانات المفتوحة | البيانات في عالم ما زال العديد من بلدانه الأكثر ثراء لا يتيح لمواطنيه الإطلاع بسهولة ويسر على البيانات الحكومية، تتقدم كينيا ومولدوفا لتتصدرا الصفوف. فخلال الأشهر الستة الماضية، تجاوز هذان البلدان سجلا قديما من التعتيم بإنشاء مواقع إلكترونية تتيح إمكانية الوصول إلى البيانات، إذ يسهل - على سبيل المثال - الإطلاع على معلومات الموازنة والتعداد ونقلها. وفي الشهر الجاري، ألقى خبراء في مجال البيانات المفتوحة نظرة عن قرب على هذه المبادرات الرائدة بحثاً عما قد يفيدهم من نصائح بشأن أفضل السبل لمساعدة بلدان نامية، مثل منغوليا ونيجيريا ورواندا، كي تخطو نحو حكومة أكثر انفتاحاً. وأبدى هؤلاء الخبراء إعجابهم بمجتمع جديد لممارسي البيانات الحكومية المفتوحة على موقع التواصل الإلكتروني LinkedIn الذي يربط بين الحكومات وخبراء علنية البيانات. وكان البنك الدولي قد أتاح للجمهور الإطلاع على قدر كبير من بياناته قبل أكثر من عام في إطار جهوده الرامية إلى تعزيز تداول المعلومات وتشجيع المبتكرين على وضع حلول برمجية للمشكلات الإنمائية. جهود البيانات المفتوحة بحاجة إلى "مناصر" من الحكومات إيجاد قناة مستدامة لضخ البيانات
The best mentor of all tim... Data Dissemination to the Government of Haiti | Off the Map - Of OpenStreetMap in the World Bank Haiti Situation Room For the past 3 weeks, since January 12, we’ve been actively involved in many efforts to provide support and analysis of the Haiti earthquake recovery. From immediate OpenStreetMap efforts to get imagery open licensed and traced, to working through CrisisCommons to get new volunteers mapping, creating dashboard common operating pictures of population affected by the event, emerging IDP camp locations, distribution centers, and gathering normalized health facilities around the country. Historically, these tools have been useful for the public and media to cover an event – but the question often arose if they were beneficial to responders and citizens on the ground. It’s been clear that tools such as OpenStreetMap have had a clear and positive impact on the response and recovery efforts. Organizations from the World Bank, to MapAction, to the Fairfax Search and Rescue teams have all been using OSM as a primary means of maps and routing.
11 Ways to Visualize Changes Over Time – A Guide | FlowingData Deal with data? No doubt you've come across the time-based variety. The visualization you use to explore and display that data changes depending on what you're after and data types. This is a guide to help you figure out what type of visualization to use to see that stuff. Let's start with the basics: the line graph. An example: Comparing Roger Clemens to Hall of Fame Pitchers Scatterplots work well if you have a lot of data points. An example: Oxygen Concentration Over Time Bar charts work best for time series when you're dealing with distinct points in time (as opposed to more continuous data). An example: Who’s Going to Win Nathan’s Hot Dog Eating Contest? Use this the same way you would a bar chart when you have multiple categories (hence the stacking). An example: Bad Housing Loans in Forclosure The stacked area is the stacked bar's more versatile sibling. An example: Past 25 Years of Consumer Spending An example: Income per Person and GDP by Gapminder
Citizens ask for access to public data - New Brunswick - CBC News | the internet of things, open data and the city
Open Data. The power of the many facilitated by the web by wcolmen Feb 19