
Satellite Projection Explorer.
Hashbang. D3.js Geo fun WARNING: Heavy CPU Usage ahead.

I recently decided to create some mapping visualisations. Mostly because mapping is required by many visualisations, and creating such visualisation is a skill I lacked. I initially looked at Kartograph which has a python back-end to generate maps, and a CoffeeScript library for client side visualisation. This sounded great because it involved two of my favourite languages. I then started to look at D3.js new features in version 3. Examples Here is an example I edited from here. ...var width = 480, height = 250; var projection = d3.geo.equirectangular() .scale(75) .translate([width/2,height/2]) .rotate([-180,0]); var path = d3.geo.path() .projection(projection); var svg = d3.select("#js-map-nz-center").append("svg") .attr("width", width) .attr("height", height); svg.selectAll(".graticule") .data([topojson.object(worldtopo, worldtopo.objects.land)]) .enter() .append("path") .attr("class", "land") .attr("d", path);...
The basic steps are: Scale. Mapshaper. Line Simplification. Source: Natural Earth, 1:10m resolution.
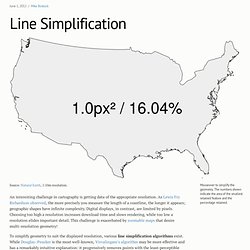
An interesting challenge in cartography is getting data of the appropriate resolution. As Lewis Fry Richardson observed, the more precisely you measure the length of a coastline, the longer it appears; geographic shapes have infinite complexity. Digital displays, in contrast, are limited by pixels. Choosing too high a resolution increases download time and slows rendering, while too low a resolution elides important detail. This challenge is exacerbated by zoomable maps that desire multi-resolution geometry! To simplify geometry to suit the displayed resolution, various line simplification algorithms exist. To determine which point removal incurs the smallest visible change, Visvalingam’s algorithm computes triangles formed by successive triplets of points along each line; the point with the smallest associated triangle is removed. For example, consider this line of six points:
Natural Earth. Spatial Reference List. Free on-line GIS data format and coordinates converter. Tutorials. Let’s Make a Map. In this tutorial, I’ll cover how to make a modest map from scratch using D3 and TopoJSON.
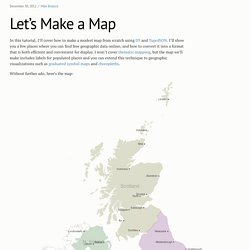
I’ll show you a few places where you can find free geographic data online, and how to convert it into a format that is both efficient and convenient for display. I won’t cover thematic mapping, but the map we’ll make includes labels for populated places and you can extend this technique to geographic visualizations such as graduated symbol maps and choropleths. Without further ado, here’s the map: Shown are the four constituent countries of the United Kingdom: Scotland, Northern Ireland, Wales and England. As maps go, it’s not particularly interesting, but the simplicity should serve adequately to demonstrate the basics of map-making. #Finding Data The first task for any map is finding geometry.
Unfortunately, government data can sometimes be hard to find or use. For a crowdsourced alternative, GeoCommons is a platform for sharing geographic datasets. #Installing Tools brew install gdal #Converting Data. Geo Projections · mbostock/d3 Wiki. Wiki ▸ API Reference ▸ Geo ▸ Geo Projections Several common projections are included with default build of D3; these are shown below.
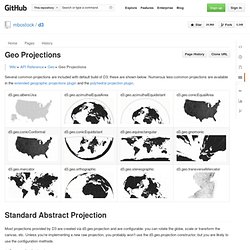
Numerous less-common projections are available in the extended geographic projections plugin and the polyhedral projection plugin. Standard Abstract Projection Most projections provided by D3 are created via d3.geo.projection and are configurable: you can rotate the globe, scale or transform the canvas, etc. Unless you’re implementing a new raw projection, you probably won’t use the d3.geo.projection constructor, but you are likely to use the configuration methods. Geo Paths · mbostock/d3 Wiki. Wiki ▸ API Reference ▸ Geo ▸ Geo Paths For cartographic visualizations, D3 supports a handful of components for displaying and manipulating geographic data.
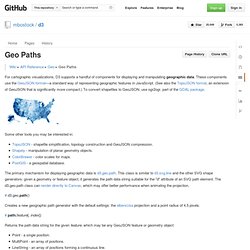
These components use the GeoJSON format—a standard way of representing geographic features in JavaScript. (See also the TopoJSON format, an extension of GeoJSON that is significantly more compact.) To convert shapefiles to GeoJSON, use ogr2ogr, part of the GDAL package. Some other tools you may be interested in: d3.js - D3js: How to design topographic maps.
Examples. Topography. Iceland Topography. Body { margin: 0; overflow: hidden;
Cartograms with d3 & TopoJSON. Heatmap (Canvas, JSON) Force-Directed States of America. Satellite Projection. World Tour. Azimuth and Distance from London.