
RSA Animate - The Internet in Society: Empowering or Censoring Citizens? OpenRefine. Data Wrangler. UPDATE: The Stanford/Berkeley Wrangler research project is complete, and the software is no longer actively supported.
Storytelling with Data. Feb. 28, 2013 This is a condensed version of my opening keynote at the Tapestry Conference, which was held yesterday in Nashville’s beautiful Union Station Hotel.
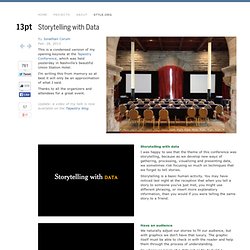
I’m writing this from memory so at best it will only be an approximation of what I said. Thanks to all the organizers and attendees for a great event. Update: a video of my talk is now available on the Tapestry blog. Storytelling with data I was happy to see that the theme of this conference was storytelling, because as we develop new ways of gathering, processing, visualizing and presenting data, we sometimes risk focusing so much on techniques that we forget to tell stories. Storytelling is a basic human activity. Have an audience. Emotional Data Visualization: Periscopic's "U.S. Gun Deaths" and the Challenge of Uncertainty. The Royal Weddings Social Impact - INFOGRAPHIC on Behance. Choosing_a_good_chart. Infographics: How to Strike the Elusive Balance between Data and Visualization.
They started out as a social media experiment and then suddenly everyone wanted a piece.
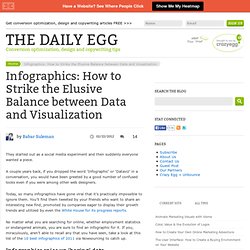
A couple years back, if you dropped the word ‘Infographic’ or ‘Dataviz’ in a conversation, you would have been greeted by a good number of confused looks even if you were among other web designers. Today, so many infographics have gone viral that it’s practically impossible to ignore them. You’ll find them tweeted by your friends who want to share an interesting new find, promoted by companies eager to display their growth trends and utilized by even the White House for its progress reports. No matter what you are searching for online, whether employment statistics or endangered animals, you are sure to find an infographic for it.
Utiliser Google Drive : découvrir les nouvelles fonctionnalités. Data. 16 Top Big Data Analytics Platforms. Data analysis is a do-or-die requirement for today's businesses. We analyze notable vendor choices, from Hadoop upstarts to traditional database players. 1 of 17 Revolutionary. That pretty much describes the data analysis time in which we live. Businesses grapple with huge quantities and varieties of data on one hand, and ever-faster expectations for analysis on the other. Apache Hadoop, a nine-year-old open-source data-processing platform first used by Internet giants including Yahoo and Facebook, leads the big-data revolution. In-memory analysis gains steam as Moore's Law brings us faster, more affordable, and more-memory-rich processors. Advances in bandwidth, memory, and processing power also have improved real-time stream-processing and stream-analysis capabilities, but this technology has yet to see broad adoption. Plenty of vendors covered here offer cloud options, but 1010data and Amazon Web Services (AWS) have staked their entire businesses on the cloud model.
OpenRefine. Data Visualization, Infographics, and Statistics. Resources. Covering the Extractives Industry: Big Data, New Tools, and Journalism. This paper was presented during the professor's track at the Global Investigative Journalism Conference in October 2013 in Rio De Janeiro.

For more on educators and investigative reporting, see the Investigative Journalism Education Consortium. Pay No Mind in Flickr (CC License) The one thing we know is that our efforts have empowered journalists, if only they take advantage of it. Our most effective efforts in the struggle against the resource curse have been those aimed at transparency.
There is information available now of a quality and detail that traditional civil society organizations are not used to dealing with. -- Law Prof. Introduction The extractives sector (oil, gas, and mining) continues to be an important subject for journalists, particularly in developing countries. The companies in the extractive sector are large and influential. How the revenues from the extraction of natural resources are spent affects economic growth, domestic security, and social well-being. 10 tools that can help data journalists do better work, be more efficient. It’s hard to be equally good at all of the tasks that fall under data journalism.
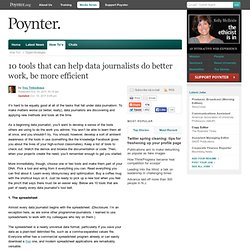
To make matters worse (or better, really), data journalists are discovering and applying new methods and tools all the time. As a beginning data journalist, you’ll want to develop a sense of the tools others are using to do the work you admire. You won’t be able to learn them all at once, and you shouldn’t try. You should, however, develop a sort of ambient awareness of the tools in use (something like the knowledge Facebook gives you about the lives of your high-school classmates). Keep a list of tools to check out. Recipes · OpenRefine/OpenRefine Wiki. Useful recipes for achieving certain tasks in OpenRefine This page collects OpenRefine recipes, small workflows and code fragments that show you how to achieve specific things with OpenRefine.
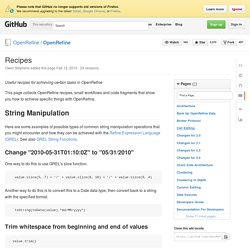
String Manipulation Here are some examples of possible types of common string manipulation operations that you might encounter and how they can be achieved with the Refine Expression Language (GREL). See also GREL String Functions.