
7 Cash Flow Ratios Every Value Investor Should Know. Written by Jae Jun follow me on Facebook Twitter To get this kind of information and other exclusive articles before regular readers, get on the VIP Mailing List today.
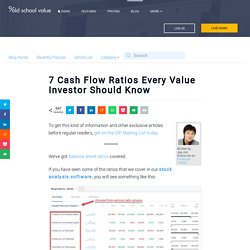
We’ve got balance sheet ratios covered. If you have seen some of the ratios that we cover in our stock analysis software, you will see something like this: Balance sheet and income related ratios are one of the first sets of financial ratios you learn to use when analyzing a company. Current and Quick RatioDebt to EquityReturn on Equityand so on Very popular and common. Before you dive into the meat of the content, if you haven’t signed up with your email for our free investment resources, do so.
I’ll immediately send you extra stock ratios notes, checklists, spreadsheets and additional downloads you can succeed with. What the Balance Sheet and Income Statement Ratios Miss When it comes to doing a liquidity or solvency analysis, using the cash flow statement is a better indicator than using the balance sheet or income statement. 10 Must Have Data Science Skills, Updated. An updated look at the state of the data science landscape, and the skills - both technical and non-technical - that are absolutely required to make it as a data scientist.
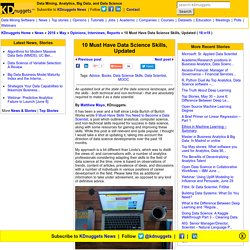
It has been a year and a half since Linda Burtch of Burtch Works wrote 9 Must-Have Skills You Need to Become a Data Scientist, a post which outlined analytical, computer science, and non-technical skills required for success in data science, along with some resources for gaining and improving these skills. While this post is still relevant and quite popular, I thought I would take a shot at updating it, taking into account the direction of data science developments over the past 18 months. Business Intelligence solutions architecture.
Disclaimer The materials in the article are consistant with the products available from IBM up to January 2005.

IBM products introduced or made available after that date are not covered. Back to top Introduction In today's warehouse environment, organizations are more successful with sound architectures. In the mid to late 1990's, IBM introduced a Blueprint for Data Warehousing that aided data integrity and process consistency through the persistent data store (Central Data Warehouse or CDW). Now information consumers are demanding timely answers to more complex questions that require processing of data from a variety of sources. This article is a presentation of the latest and best available toolsets and approaches that will aid the BI specialist in being able to source data and assimilate it into information that will provide value to the information consumer.
Beyond Informing, Making Decisions, by Neil Raden. Understanding Analytical Types and Needs. By Neil Raden, January, 2013 Purpose and Intent “Analytics” is a critical component of enterprise architecture capabilities, though most organizations have only recently begun to develop experience using quantitative methods.
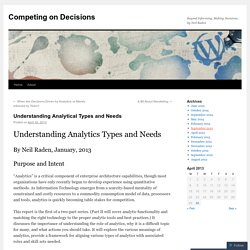
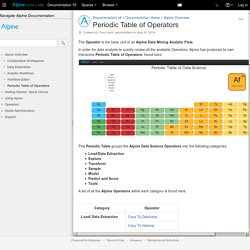
As Information Technology emerges from a scarcity-based mentality of constrained and costly resources to a commodity consumption model of data, processors and tools, analytics is quickly becoming table stakes for competition. This report is the first of a two-part series. (Part II will cover analytic functionality and matching the right technology to the proper analytic tools and best practices.) Executive Decision Making - The Five Phases. Interactive Periodic Table of Machine Learning Libraries. Periodic Table of Operators - Documentation v5 - Documentation V5. The Operator is the basic unit of an Alpine Data Mining Analytic Flow.
In order for data analysts to quickly review all the available Operators, Alpine has produced its own interactive Periodic Table of Operators, found here: This Periodic Table groups the Alpine Data Science Operators into the following categories: Load/Data ExtractionSampleExplore TransformModelPredict and ScoreValidateTools A list of all the Alpine Operators within each category is found here: Periodic Table of Operators - Documentation v4 - Documentation V5. The Operator is the basic unit of an Alpine Data Mining Analytic Flow.
The Agile Marketing Revolution: Using Automated, Cross-Channel Campa… Origami logic-periodic-table-of-marketing-signals. Marketing Intelligence, Analytics, Reports, Dashboards. Marketing Signal Measurement, Analytics, Reports, Dashboards. The biggest bottleneck to insights is not having the data you need, when you need it.

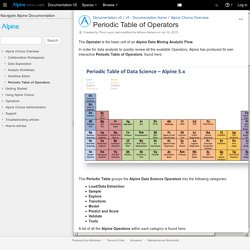
When your marketing signals are scattered across hundreds of different accounts, reports, and spreadsheets, digging through them to find and compile information can be a process that takes days if not weeks. To make things harder, gathering just any data isn’t good enough. You’ve heard the expression “garbage in, garbage out”: if your signals are of subpar quality, the insights you gain from them will also be shallow, delayed, or worse yet, misleading. Infographic depicting unique differences between data scientists and business analysts.
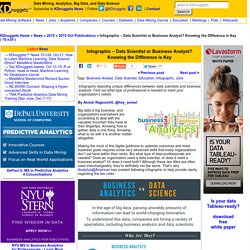
Find out what type of professional is needed to meet your organization’s needs. By Anmol Rajpurohit, @hey_anmol Big data is big business, and organizations everywhere are scrambling to deal with the valuable mountain they have at their fingertips. Knowing how to gather data is one thing. Knowing what to do with it is another matter altogether. Making the most of this digital goldmine to optimize outcomes and meet business goals requires some very advanced skills that many organizations don’t yet have within their ranks. Infographic continues on page 2.