
Computational Finance. 1. Quickstart — DX Analytics 0.1.1 documentation. This brief first part illustrates—without much explanation—the usage of the DX Analytics library.
It models two risk factors, two derivatives instruments and values these in a portfolio context. import dximport datetime as dtimport pandas as pdfrom pylab import pltplt.style.use('seaborn') 1.1. Risk Factor Models The first step is to define a model for the risk-neutral discounting. r = dx.constant_short_rate('r', 0.01) We then define a market environment containing the major parameter specifications needed, me_1 = dx.market_environment('me', dt.datetime(2016, 1, 1)) How it works – Séries Temporelles. Pandas · Initiation à Python pour le traitement de données. SeriesDataFramePanel récupérer des données depuis des fichiers CSV, tableaux Excel, des pages web, HDF5, etc.
;grouper, découper, alléger, déplacer, écrire les données ;manipuler ces données (qui peuvent être à une ou deux dimensions), avec des manques, ou encore de façon temporelle avec ou sans périodicité. Tutorial: Image Rescaling. Rescaling or resampling is the technique used to create a new version of an image with a different size.
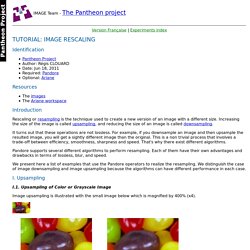
Increasing the size of the image is called upsampling, and reducing the size of an image is called downsampling. Pandore supports several different algorithms to perform resampling. Each of them have their own advantages and drawbacks in terms of lossless, blur, and speed. We present here a list of examples that use the Pandore operators to realize the resampling. We distinguish the case of image downsampling and image upsampling because the algorithms can have different performance in each case. Exemples de traitement d’image — Page personnelle de Dimitri Bonnet. Python-machine-learning-book/ch03.ipynb at master · rasbt/python-machine-learning-book. LET DEODAT DE SEVERAC. Candlestick Charts. What About Dash?
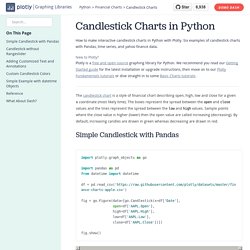
¶ Dash is an open-source framework for building analytical applications, with no Javascript required, and it is tightly integrated with the Plotly graphing library. Learn about how to install Dash at Everywhere in this page that you see fig.show(), you can display the same figure in a Dash application by passing it to the figure argument of the Graph component from the built-in dash_core_components package like this: import plotly.graph_objects as go # or plotly.express as pxfig = go.Figure() # or any Plotly Express function e.g. px.bar(...)# fig.add_trace( ... )# fig.update_layout( ... ) import dashimport dash_core_components as dccimport dash_html_components as html app = dash.Dash()app.layout = html.Div([ dcc.Graph(figure=fig)]) app.run_server(debug=True, use_reloader=False) # Turn off reloader if inside Jupyter.
SystemML Algorithms Reference - SystemML 1.2.0. · Friedenthal, Moore, Steiner: A Practical Guide to SysML, 2nd Editionnd Edition · Welcome. "SysML is the new industry-standard language designed specifically to support modern systems engineering.
I cannot imagine a better way to learn SysML than to read about it from the masters: Friedenthal, Moore, and Steiner led the design of this important new language and now cap that effort with this comprehensive and highly readable guide for both novices and experts. " -Bran Selic, Malina Software Corporation "This book is just the ticket you need to get started on the road to adopting standards-based, model-based systems engineering (MBSE) methods.
The authors have done an outstanding job in providing detailed coverage of the SysML language and semantics supported through worked examples. " -Jeff Estefan, Principal Engineer, NASA's Jet Propulsion Laboratory. Mbse:incose_mbse_iw_2020 [MBSE Wiki] Back To MBSE Initiative Wiki Systems Engineering Transformation and Model Based Systems Engineering (MBSE) Initiative at INCOSE IW 2020 (Jan. 25 - 28) Continuing on the theme of Transformation of Systems Engineering, this year’s agenda will focus on current practices, advancements and collaborative efforts across the systems modeling community, including: Like last year, the MBSE Workshop will be an integrated activity occurring over the full duration of the International Workshop.
![mbse:incose_mbse_iw_2020 [MBSE Wiki]](http://cdn.pearltrees.com/s/pic/th/mbse-incose-iw-2020-wiki-221755160)
We invite you to join us on the cutting-edge of systems engineering for a riveting workshop. · Friedenthal, Moore, Steiner: A Practical Guide to SysML, 2nd Editionnd Edition · Welcome. "SysML is the new industry-standard language designed specifically to support modern systems engineering.

I cannot imagine a better way to learn SysML than to read about it from the masters: Friedenthal, Moore, and Steiner led the design of this important new language and now cap that effort with this comprehensive and highly readable guide for both novices and experts. " -Bran Selic, Malina Software Corporation "This book is just the ticket you need to get started on the road to adopting standards-based, model-based systems engineering (MBSE) methods. The authors have done an outstanding job in providing detailed coverage of the SysML language and semantics supported through worked examples. " -Jeff Estefan, Principal Engineer, NASA's Jet Propulsion Laboratory "The authors of this book have been invovlded in SysML development since its inception, and have the understanding necessary to explain it clearly.
6 Essential Data Visualization Python Libraries - Analytics Vidhya. PacktPublishing/Geospatial-Data-Science-Quick-Start-Guide: Geospatial Data Science Quick Start Guide, published by Packt. NetworkX – groupe fmr. Dans le cadre d’un enseignement sur les risques à l’Ecole Nationale des Ponts et Chaussées, j’ai élaboré une séquence de cours concernant plus spécifiquement les réseaux techniques.
Ateliers-open-geek/Atelier_09.md at master · HackYourResearch/ateliers-open-geek. Exploring and Analyzing Network Data with Python. Contents Lesson Goals In this tutorial, you will learn: To use the NetworkX package for working with network data in Python; and To analyze humanities network data to find: Network structure and path lengths, Important or central nodes, and Communities and subgroups.
Intro to Graph Optimization with NetworkX in Python. With this tutorial, you'll tackle an established problem in graph theory called the Chinese Postman Problem.
There are some components of the algorithm that while conceptually simple, turn out to be computationally rigorous. However, for this tutorial, only some prior knowledge of Python is required: no rigorous math, computer science or graph theory background is needed. Learn How to Perform Feature Extraction from Graphs using DeepWalk. Introduction to Graph Theory and its Implementation in Python. Explained.ai. Preprocess: LDA and Kernel PCA in Python – Charles' Hodgepodge. (72) Spatial data and web mapping with Python. S-Dot 1.2. First, you have to type or generate an s-expression such as the one above. GraphViz Examples and Tutorial. Python Advanced: Graphs in Python: NetworkX. Overview NetworkX is a Python language software package for the creation, manipulation, and study of the structure, dynamics, and functions of complex networks.
Pygraphviz is a Python interface to the Graphviz graph layout and visualization package. Python language data structures for graphs, digraphs, and multigraphs. Nodes can be "anything" (e.g. text, images, XML records) Edges can hold arbitrary data (e.g. weights, time-series) Generators for classic graphs, random graphs, and synthetic networks Standard graph algorithms Network structure and analysis measures Basic graph drawing Open source BSD license Well tested: more than 1500 unit tests Additional benefits from Python: fast prototyping, easy to teach, multi-platform Creating a Graph.
Blog bioinformatique communautaire scientifique. Derrière ce titre énigmatique, qui n'aura pas été sans vous rappeler la fameuse phrase du Petit Prince d'Antoine de Saint Exupéry, se cache un module pour Python qui dira sûrement quelque chose à nos lecteurs assidus spécialisés dans les graphes : pygraphviz ! Ce module a été créé autour de GraphViz et vous permet ainsi de faire des graphes sous Python en respectant les normes établies par GraphViz et, par conséquent, d'exporter ou d'importer très facilement vos graphes pour vos différents projets. Astropy. Image Deconvolution — skimage v0.18.dev0 docs. In this example, we deconvolve an image using Richardson-Lucy deconvolution algorithm (, ).
The algorithm is based on a PSF (Point Spread Function), where PSF is described as the impulse response of the optical system. The blurred image is sharpened through a number of iterations, which needs to be hand-tuned. Automate the Boring Stuff with Python. PDF and Word documents are binary files, which makes them much more complex than plaintext files. In addition to text, they store lots of font, color, and layout information. If you want your programs to read or write to PDFs or Word documents, you’ll need to do more than simply pass their filenames to open(). Fortunately, there are Python modules that make it easy for you to interact with PDFs and Word documents. Untitled. This page is divided in three sections: Music software written in Python, Music programming in Python, and Music software supporting Python Bluemindo - Bluemindo is a really simple but powerful audio player in Python/PyGTK, using Gstreamer.
Bluemindo is a free (as in freedom) software, released under GPLv3, only. cplay - a curses front-end for various audio players edna - an MP3 server, edna allows you to access your MP3 collection from any networked computer. The web pages are dynamically constructed, adjusting to directory structure and the files in those directories. This is much nicer than using simple directory indexing.
Rather than directly serving up an MP3, the software serves up a playlist. Docs: Pandas Recipes. This page contains code snippets that focus on working with pandas, a popular Python library that is used throughout the Quantopian API. Most Quantopian API functions that output data or results do so in the form of a pandas data structure like a Series or a DataFrame. The recipes below illustrate some of the techniques you can use to manipulate these data structures.
18 meilleures sources de datasets pour la Data science. Où trouver les meilleurs ensembles de données gratuits et publics. Skip to main content Où trouver les meilleurs ensembles de données gratuits et publics. Initiation au Machine Learning avec Python - La pratique. Présentation de l'écosystème Python scientifique. Sommaire. 10 sites de référence de l'open data - Stat4decision. Télécharger les vidéos de formation Udemy avec Python. Welcome to Orfeo ToolBox! — Orfeo ToolBox 7.1.0 documentation. Overview — Sphinx 4.0.0+ documentation. Pydecisions — A Python Library of management decision making techniques. In today’s world, we know the importance of taking logical decisions based on data. Projet Machine Learning pour la Prévision: introduction. Finalité M2 Statistiques et Machine Learning. (62) Reproducible Data Analysis in Jupyter, Part 1/10: Loading and Visualizing Data. K-means Cluster Analysis · UC Business Analytics R Programming Guide.
Xavier Dupré, ENSAE, Microsoft. Projet Machine Learning pour la Prévision: introduction. Exercise: Your First Machine Learning Model. Learn to Build your First Speech-to-Text Model in Python. What is TensorFlow? Top various uses of TensorFlow. Bienvenue dans Colaboratory - Colaboratory. Chris Albon. P-Value - Understanding from Scratch. Module requests : Jouons avec Http et python. Scraping & Machine Learning : comment fonctionne un moteur de recherche ? Fouille de données textuelles à partir des "Exercices de style" de R. Queneau — Wiki du LAMA (UMR 5127) Dive Into Python. Greedy Algorithms. Machine Learning with Python: Decision Trees in Python. Python Data Science Handbook. Decision Tree Algorithm, Explained.
1.10. Decision Trees — scikit-learn 0.22.2 documentation. Decision Tree In Python. Decision tree implementation using Python. Classification et régression — papierstat. HIPR Top Page. NCAR Command Language (NCL) User guide: contents — scikit-learn 0.22.2 documentation. TD7 - Analyse de texte — Python dans tous ses états 0.9.2978.2978.
Accueil - Machine Learnia. Les f-chaînes, la méthode format — Documentation. (43) Machine Learnia. A gallery of interesting Jupyter Notebooks · jupyter/jupyter Wiki. Publications dans Mathématiques. 1A.data - DataFrame et Matrice — Python dans tous ses états 0.9.2964.2964. Intro matlab 4up. LyceeGT ressource ISN 20 06 Tle S 22 Traitement images 2 218271. Images. l2 idea octave cm. Python dans tous ses états — Python dans tous ses états 0.8.1785. Expressions idiomatiques-anglais. Revolutions. WikiStat & Data Science. Python: le module Shapely, géométries, prédicats spatiaux, analyse spatiale, matrices de Clementini (DE-9IM), traitements de shapefiles ou autres, et représentation avec matplotlib.
Help. 2. BIBLIO/WEBO-GRAPHIE — Road Book Python v1.3.5. Pycse - Python Computations in Science and Engineering. Free Online IDE and Terminal. Python Tutorial: Lambda Operator, filter, reduce and map. Description des systèmes automatiques, boucle fermée. XD blog. Python, Scipy - f2py - ... Programmation Python - Irma-wiki. Classement. France-IOI. Calque. Algorithm Tutorials. Python Course: Introduction into the Sys Module. Programmation en Python pour les mathématiques.