
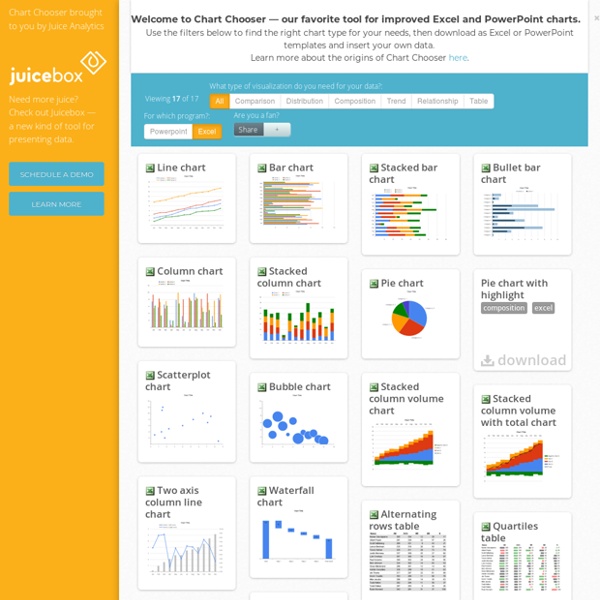
http://labs.juiceanalytics.com/chartchooser/index.html
Related: Data visualization, infografica, mindmapping • Tableur4journos • Math ToolsGallery · mbostock/d3 Wiki Wiki ▸ Gallery Welcome to the D3 gallery! More examples are available for forking on Observable; see D3’s profile and the visualization collection. Please share your work on Observable, or tweet us a link! Visual Index Extreme Presentation Tools - Extreme Presentation We’ve consolidated all the most useful tools from the Extreme Presentation method here. Feel free to contact us and let us know if there is anything you would like us to add. The tools are below.
The 14 Best Data Visualization Tools Nishith Sharma is the co-founder of frrole, a social intelligence startup. Raw data is boring and it’s difficult to make sense of it in its natural form. Add visualization to it and you get something that everybody can easily digest. Not only you can make sense of it faster, but you can also observe interesting patterns that wouldn’t be apparent from looking only at stats. All Killer, No Filler This one’s different, trust us.
Evernote: A 0-to-60 MPH Guide Evernote is many things to many people because it’s so powerful. But for the same reason, Evernote’s purpose is vague enough that it can be hard to get started with it. First, you have to figure out what it can do for you. Here’s a guide to how to think about Evernote, so you can get better at using it. What Is Evernote? Evernote is an application that lets you create notes that sync between all your devices.
Case study: A brief review of online visualisation tools that can help There is a growing range of online tools to help users their data. This brief review highlights four online visualisation tools that can help. The links page also links to lots more useful resources. Online tools that can help visualise data (these tools are free to use, but any data uploaded is typically then available on the system for other users) highlighted below include: On the resources and links page, we also link to free software applications and libraries for visualising data, and development languages for more sophisticated data visualisation. Many Eyes
30 Simple Tools For Data Visualization There have never been more technologies available to collect, examine, and render data. Here are 30 different notable pieces of data visualization software good for any designer's repertoire. They're not just powerful; they're easy to use. In fact, most of these tools feature simple, point-and-click interfaces, and don’t require that you possess any particular coding knowledge or invest in any significant training.
Documents 2. Act normal If you are a high-risk source, avoid saying anything or doing anything after submitting which might promote suspicion. Interactive angles teaching tool acute,obtuse,measure with protractor This activity allows manipulation and investigation of various types of angles. It can be used at a variety of different grade levels. At its most basic for teaching about types of angles, acute, obtuse or reflex. For more advanced use to create angle problems in which the missing letter angle values have to be found. You can click and drag the handles to change the angles and the values will updated. What Is POP & IMAP & Which One Should You Use For Your Email? If you have ever set up an email client or app, you will have certainly come across the terms POP and IMAP. Do you remember which one you chose and why? If you are not quite sure what these terms stand for and how each affects your email account, this article will shed some light. The article explains how POP and IMAP work and will help you decide which one best fits your needs. IMAP is short for Internet Message Access Protocol, while POP translates to Post Office Protocol. In other words, both are email protocols.
Gallery "Spike" map Interactive United States population density map. Average rating: 7.5 (23 votes) Visualising Data » Resources Here is a collection of some of the most important, effective, useful and practical data visualisation tools. The content covers the many different resources used to create and publish visualisations, tools for working with colour, packages for handling data, places to obtain data, the most influential books and educational programmes and qualifications in visualisation itself. * Please note there are another 40-50 items to add to these collections but they are going to be saved for now and launched alongside the new version of this website around April * Data and visualisation tools