
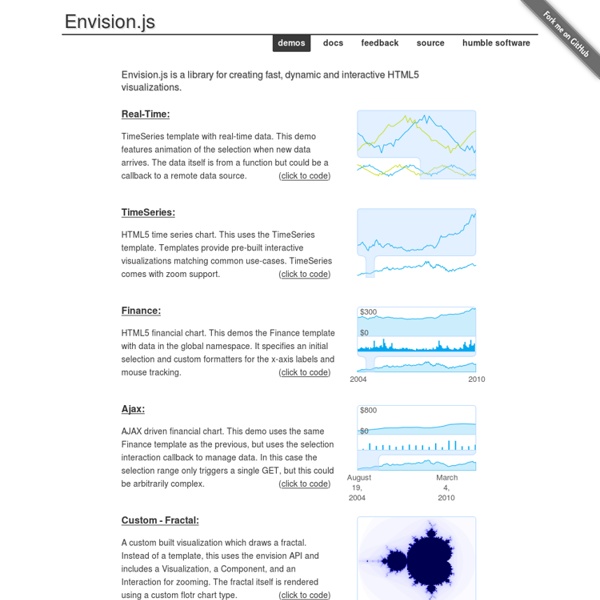
Flot: Attractive JavaScript plotting for jQuery Cubism Mike Bostock Square, Inc. * for monitoring of production systems How do we use visualization? Anomaly detection - observe abnormal activity Capacity planning - extrapolate non-linear trends Crisis diagnosis - see interactions between services System design - don’t guess; decide empirically What are the benefits of visualization? Faster diagnosis - reduce impact Discovery of unexpected behavior - prevent downtime Increased situational awareness - make better decisions Or: The strengths & weaknesses of human perception. Why is visualization hard? Data is not information - transform data to make it meaningful Some visual channels are less effective - favor position Integrality is hard to avoid - three dimensions max. Aspect ratios matter. Stacking makes middle layers hard to read. Garish colors can be hard to see. Load and render data incrementally. Make better use of modern browsers. Combine position and color to reduce vertical space. A small library, not a system. Why a context? CPU (10s) Network (10s)
Peity • progressive <canvas> pie charts Peity (sounds like deity) is a jQuery plugin that converts an element's content into a <svg> mini pie 2/5 donut 5,2,3 line 5,3,9,6,5,9,7,3,5,2 or bar chart 5,3,9,6,5,9,7,3,5,2 and is compatible with any browser that supports <svg>: Chrome, Firefox, IE9+, Opera, Safari. Download version 3.2.1 Uncompressed 8.7Kb jquery.peity.js Minified 3.6Kb (+gzipped 1.7Kb) jquery.peity.min.js Source github.com/benpickles/peity Pie Charts Call peity("pie") on a jQuery selection. You can also pass delimiter, fill, height, radius and width options. <span class="pie">1/5</span><span class="pie">226/360</span><span class="pie">0.52/1.561</span><span class="pie">1,4</span><span class="pie">226,134</span><span class="pie">0.52,1.041</span><span class="pie">1,2,3,2,2</span> JavaScript $("span.pie").peity("pie") Donut Charts Donut charts are the same as pie charts and take the same options with an added innerRadius option which defaults to half the radius. $('.donut').peity('donut') Line Charts $(".line").peity("line") Events
API Design One of the development tasks I do most often is designing the API for a reusable component. The components are usually for iOS (though sometimes they’re for OS X), and are invariably GUI controls or views of some kind. I’ve designed literally dozens of component APIs over the years, including for clients like Apple, and I’ve learned quite a bit about the process. I periodically release open source components too, and the feedback I’ve had has helped me put together a set of guidelines for API design that I’d like to share with you. This is an important topic, whether you’re an open source contributor, or working as part of a team on a large app, or just creating your own software. Just like the first launch experience of an app, your API is part of the first impression that a developer will have with your code, and will have a huge impact on whether they use it or throw it away. APIs are UX for developers. Desirable qualities IntuitiveForgivingFrictionless The developer interface It’s fine.
Sparklines News 15 June 2013 - Version 2.1.2 Relased This release adds support for jQuery 1.10.0 and other bug fixes and minor improvements. See the full changelog for details of all changes. 26 January 2013 - Version 2.1.1 Relased This release adds support for jQuery 1.9.0 along with a couple of other bug fixes. If you're using a version of jQuery later than 1.8, be extra sure you're not rendering your page in quirks mode to avoid breaking tooltips for IE users. See the full changelog for details of all changes. 15 October 2012 - Version 2.1 Released This release is primarily a bug-fix release, but also adds support for Internet Explorer 10. See the full changelog for details of all changes. 29 April 2012 - Version 2.0 Released This release represents a significant code update. Customizable mouseover tooltips and interaction including highlighting of moused-over values. It should be fully backwards compatible with the 1.x versions with the following exceptions: There's a few non-code updates as well: eg.
Protovis Protovis composes custom views of data with simple marks such as bars and dots. Unlike low-level graphics libraries that quickly become tedious for visualization, Protovis defines marks through dynamic properties that encode data, allowing inheritance, scales and layouts to simplify construction. Protovis is free and open-source, provided under the BSD License. Protovis is no longer under active development.The final release of Protovis was v3.3.1 (4.7 MB). This project was led by Mike Bostock and Jeff Heer of the Stanford Visualization Group, with significant help from Vadim Ogievetsky. Updates June 28, 2011 - Protovis is no longer under active development. September 17, 2010 - Release 3.3 is available on GitHub. May 28, 2010 - ZOMG! October 1, 2009 - Release 3.1 is available, including minor bug fixes. September 19, 2009 - Release 3.0 is available, including major performance improvments, bug fixes, and handy utilities such as scales and layouts. Getting Started How does Protovis work?
Cytoscape.js This is how easy it is to get started with Cytoscape.js (this code creates the instance you see on the bottom-right: About Cytoscape.js is an open-source graph theory library written in JavaScript. Cytoscape.js allows you to easily display and manipulate rich, interactive graphs. Cytoscape.js also has graph analysis in mind: The library contains a slew of useful functions in graph theory. Cytoscape.js is an open-source project, and anyone is free to contribute. The library was developed at the Donnelly Centre at the University of Toronto. Cytoscape.js & Cytoscape Though Cytoscape.js shares its name with Cytoscape, Cytoscape.js is not Cytoscape. Cytoscape.js is a JavaScript library: It gives you a reusable graph widget that you can integrate with the rest of your webapp with your own JavaScript code. Funding Funding for Cytoscape.js and Cytoscape is provided by NRNB (U.S. ISB | UCSD | MSKCC | Pasteur | Agilent | UCSF | Unilever | Toronto | NCIBI | NRNB Architecture & API Notation Position Data
js-mindmap Raphael Raphaël is a small JavaScript library that should simplify your work with vector graphics on the web. If you want to create your own specific chart or image crop and rotate widget, for example, you can achieve it simply and easily with this library. Raphaël uses the SVG W3C Recommendation and VML as a base for creating graphics. gRaphaël gRaphaël’s goal is to help you create stunning charts on your website. How to use Raphaël.js var paper = Raphael(10, 10, 640, 480); var paper = Raphael("canvas", 640, 480); // Creates circle at x = 50, y = 40, with radius 10var circle = paper.circle(50, 40, 10);// Sets the fill attribute of the circle to red (#f00) circle.attr("fill", "#f00"); Notice that the create method was called from the previously initialized canvas. How to use gRaphaël.js In this example we first initialize the "paper" with the placeholder. Next page:Comparison
Datavisualization.ch Selected Tools Visualization .js Lib There are plenty of JavaScript libraries out there for rendering your otherwise plain and boring numerical data into beautiful, interactive, and informative visualizations. The beauty of using JavaScript for data visualization is that, if created correctly, your data will be highly accessible (usually via HTML tables). A long time ago (2008), I wrote about JavaScript solutions for graphing and charting data and this article revisits the topic with twenty more JavaScript libraries that you can use to bring your data to life. 1. Highcharts is one of the most promising JavaScript charting libraries to hit the scene recently, with its large array of features including seven charting types (line, pie, and bar among them), the ability to zoom in and out of charts, and tooltips for offering more information about data points. 2. gRaphaël gRaphaël is a charting library based on Raphaël, a vector graphics drawing JavaScript library. 3. 4. jQuery Visualize Plugin 5. moochart 6. 7. dygraphs 8. 9. 10.