
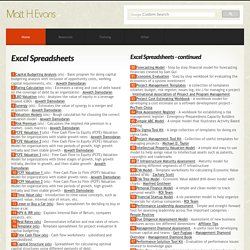
Free Excel Spreadsheets. Customized Templates | Financial Templates | High Quality Templates | Project Management |
Excel VBA Userform - Easy Excel Macros. Add the Controls | Show the Userform | Assign the Macros | Test the Userform This chapter teaches you how to create an Excel VBA Userform.
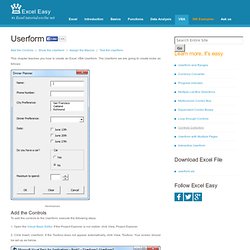
The Userform we are going to create looks as follows: Advertisement Add the Controls To add the controls to the Userform, execute the following steps. 1. Fluktuationsquote in Unternehmen. Berechnen der Fluktuationsquote im Unternehmen.
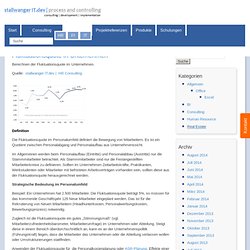
Quelle: stallwanger IT.dev | HR Consulting Definition Die Fluktuationsquote im Personalumfeld definiert die Bewegung von Mitarbeitern. Es ist ein Quotient zwischen Personalabgang und Personalaufbau aus Unternehmenssicht. Im Allgemeinen werden beim Personalaufbau (Eintritte) und Personalabbau (Austritte) nur die Stammmitarbeiter betrachtet. Strategische Bedeutung im Personalumfeld Beispiel: Ein Unternehmen hat 2.500 Mitarbeiter. Zugleich ist die Fluktuationsquote ein gutes „Stimmungsmaß“ (vgl. Anwenden der Fluktuationsquote für die Personalkostenplanung oder ASR-Planung. Berechnung der Fluktuationsquote – Formel.
HR-KPI-Tool für Excel. Anwenderfreundliches Excel HR–KPI–Tool für Personalcontrolling und -reporting zur Unterstützung von Top-Management-Entscheidungen und Unternehmenssteuerung Screenshot-Galerie Produktvideo Für die Steuerung und die Ausrichtung eines Unternehmens ist es wichtig, den Mitarbeiterstand und die strategischen Kennziffern zu kennen, um nachhaltige und langfristige Werte zu schaffen.
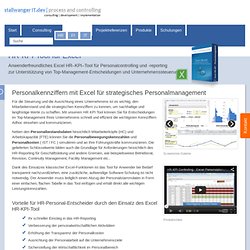
Mit unserem HR KPI Tool können Sie für Entscheidungen im Top-Management Ihres Unternehmens schnell und effizient die wichtigsten Kennziffern Adhoc einsehen und kommunizieren. Neben den Personalbestandsdaten hinsichtlich Mitarbeiterköpfe (HC) und Arbeitskapazität (FTE) können Sie die Personalbewegungskennzahlen und Personalkosten ( IST / FC ) simulieren und an Ihre Führungskräfte kommunizieren. Dank des Einsatzes klassischer Excel-Funktionen ist das Tool für Anwender bei Bedarf transparent nachzuvollziehen, eine zusätzliche, aufwendige Software-Schulung ist nicht notwendig. Excel Hack Map. Lately I've been working on two unrelated projects that just happened to intersect in a useful way.

The first project was playing with spatial binning techniques as one of the ways to map relative proportions of things without being tied to (arbitrary) political boundaries. The second was messing around with Excel pivot tables to find meaningful long term time-of-day trending in traffic fatality data (inspired by Nathan Yau's work here). Here's a one degree by one degree pivot table in Excel that also happens to be a map.
That same data with way more rows and columns. These maps won't win any awards for style or rigor (raw fatality counts essentially replicate a map of the US highway system), but the result is a pretty handy way of binning up spatial data and generating a workable exploratory map in five minutes or less. Darkhorse Analytics. All Articles on Dynamic Charts. Today lets close some gaps.
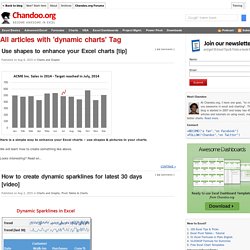
Recently I saw this interesting chart on Economist Daily Charts page. This chart is based on World Economic Forum’s survey on how women compare to men in terms of various development parameters. First take a look at the chart prepared by Economist team. So what are the gaps in this chart? This chart fails to communicate because, All country charts look same, thus making it difficult to spot any deviations.We cannot quickly compare one country with another on any particular indicator.It does not provide a better context (for eg. how did these countries perform last year?) But criticizing someone’s work is not awesome. Continue » Hi folks, I have a quick announcement & a creative dashboard to share with you. Only few hours left to join our Power Pivot course… As you may know, I have opened enrollments for our 2nd batch of Power Pivot course few days ago.
We will be closing the doors of this program at midnight, today (11:59 PM, Pacific time, Friday, 16th of August). Guide To Excel For Finance: Valuation Methods. DCF There is not a specific function to run a full discounted cash flow model in Excel, but there are a number of tools to make the exercise much more straightforward.
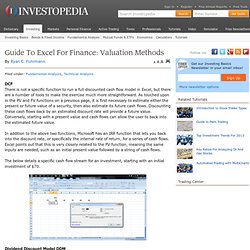
As touched upon in the PV and FV functions on a previous page, it is first necessary to estimate either the present or future value of a security, then also estimate its future cash flows. Discounting these cash flows back by an estimated discount rate will provide a future value. Conversely, starting with a present value and cash flows can allow the user to back into the estimated future value. Bollinger Bands. Bollinger Bands are a technical trading tool created by John Bollinger in the early 1980s.

The purpose of Bollinger Bands is to provide a relative definition of high and low.Bollinger Bands consist of a set of three curves drawn in relation to securities prices. The middle band is a measure of the intermediate-term trend, usually a simple moving average, that serves as the base for the upper and lower bands. The interval between the upper and lower bands and the middle band is determined by volatility,typically the standard deviation of the same data that are used for the average. The default parameters,are 20day (periods) and two standard deviations: Technical Analysis for beginners. Technical Analysis for beginners. Musings on Markets.
Building your First Monte Carlo Simulation Model in Excel. Cash Flow Modelling Training. 3-Tages-Praxis-Seminar vom 02. bis 04.

Juni 2014 im TRYP Hotel Berlin Mitte.