
Gallery of Data Visualization - Introducton. This Gallery of Data Visualization displays some examples of the Best and Worst of Statistical Graphics, with the view that the contrast may be useful, inform current practice, and provide some pointers to both historical and current work.
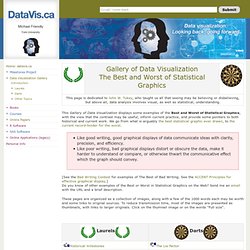
We go from what is arguably the best statistical graphic ever drawn, to the current record-holder for the worst. Like good writing, good graphical displays of data communicate ideas with clarity, precision, and efficiency. Like poor writing, bad graphical displays distort or obscure the data, make it harder to understand or compare, or otherwise thwart the communicative effect which the graph should convey. [See the Bad Writing Contest for examples of The Best of Bad Writing. See the ACCENT Principles for effective graphical display.] Do you know of other examples of the Best or Worst in Statistical Graphics on the Web? Create a timeline of famous scientific experiments. Track your family's water usage. Introduction Some of us take water, a basic necessity for sustaining human life, for granted.
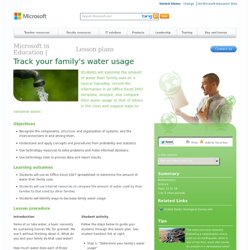
We use it without thinking about it. What do you and your family do that uses water? How much water does each of these activities typically require? For example, how much water does a five-minute shower use? Computer Technology Assignment 1 - MrsRees ... - GoBookee.net. Www.frostmiddleschool.org/ourpages/auto/2011/1/18/46764950/Creating-a-Word-Search-with-Excel.pdf. Www.frostmiddleschool.org/ourpages/auto/2011/1/18/46764950/MSExcelAVGMAXMINFunctionsEnergyDrinks.pdf. Www.frostmiddleschool.org/ourpages/auto/2011/1/18/46764950/MSExcelBasicsSimpleFormulae.pdf. Www.frostmiddleschool.org/ourpages/auto/2011/1/18/46764950/Excel-Picture-Challenge.pdf. NORTH CUMBERLAND MIDDLE SCHOOL activities. *Communication Technology* Manufacturing Technology* Construction Technology*Transportation Technology*Energy and Power Technology 8th Grade Activity Computer Literacy Microsoft Excel Assignment 2 Introduction: The students will create an edit a worksheet in Microsoft Word using the skills learned in class.
Word File A Picture of Abraham Lincoln Microsoft Word Assignment 1 Microsoft Excel Assignment 3 Introduction: This assignment requires the student to organize information, create a chart and analyze the data in the chart. Print Assignment Introduction:The students will create an edit a spreadsheet document using the skills learned in class. EUSES Spreadsheet Problems for Students. Empowerstudents - Advanced Excel and Using Formulas. Excel lesson templateHow to enter formulas You are able to write any formula in Microsoft Excel.
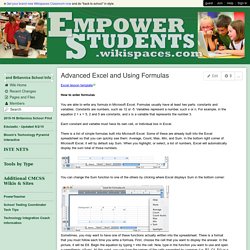
Formulas usually have at least two parts: constants and variables. Constants are numbers, such as 12 or -5. Variables represent a number, such x or n. For example, in the equation 2 + x = 5, 2 and 5 are constants, and x is a variable that represents the number 3. Each constant and variable must have its own cell, or individual box in Excel. You can change the Sum function to one of the others by clicking where Excel displays Sum in the bottom corner: Sometimes, you may want to have one of these functions actually written into the spreadsheet. This equation will be the coding (the programming that tells Excel what to do) behind the cell. When you enter a formula in Microsoft Excel, it can only solve for one variable at a time. Blooms Taxonomy and Telecommunications.
Empowerstudents - Excel for Middle and High School Math. Excel for the Middle and High School Math Classroom Introduction This 3 hour professional development is designed to help middle and high school teachers become familiar and comfortable with Excel applications.
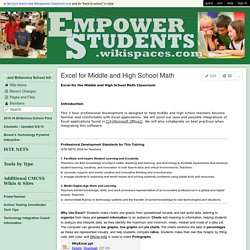
We will point out uses and possible integrations of Excel applications found in [[#|Microsoft Office]]. We will also collaborate on best practices when integrating this software. Professional Development Standards for This Training ISTE NETS 2008 for Teachers1. Facilitate and Inspire Student Learning and CreativityTeachers use their knowledge of subject matter, teaching and learning, and technology to facilitate experiences that advance student learning, creativity, and innovation in both face-to-face and virtual environments. Why Use Excel? The term spreadsheet was derived from a large piece of paper that accountants used for [[#|business finances]]. Cynthia Lanius' Mathematics Lesson: Right- or Left-Handed Data Collection. Excel Resources. Spreadsheet. Ideas for Using Excel in the Classroom. Spreadsheets. Exploring Mean, Median, and Mode.
Teach.fcps.net/trt10/Documents/12days.pdf. Www.henderson.kyschools.us/LinkClick.aspx?fileticket=PofDAwv3KTw%3D&tabid=2677. The Data Library. Sets. American FactFinder. Dr. Alice Christie's Using Spreadsheets in K-12 Classrooms. Graphing Linear Functions - Claris Works. Claris Works is often used for its word processing features but it is a wonderful tool to use for making graphs. The following steps can be used with students to have them create graphs of linear functions. Accompanying lessons on polynomial functions and/or exponential functions can be used separately or to compare the three types of functions.
Step One Open Claris Works. Make a new file. Select spreadsheet . At this point I like to have students Copy the graph Open a new file - word processing Paste the graph Write a description of what they did and what the graph represents. LT Technologies - Spreadsheet Resources. Teaching with Technology » Blog Archive » Stacking Oreos! (and graphing them too) Excel. Create a timeline in Microsoft Excel. Who's the Greatest? (Middle, other) Other, level: Middle Posted Wed Jul 28 06:47:40 PDT 1999 by Joe O'Brien ( jobrien624@yahoo.com ).
ESPN's Baseball Stats Pennbrook Middle School, North Wales, PA Materials Required: newspapers--either hard copy or on-line; computers Activity Time: approx. 1 week Concepts Taught: persuassive writing, reading and understanding graphs and statistics Integrated Lesson Plan: Baseball Stats and Opinion Grade Level/Rationale: This is an interdisciplinary lesson intended for middle school students.
Ideally the lesson would be team-taught by the English and math teachers, along with assistance from the technology department. This activity will use students’ interest in sports to introduce them to tables, spreadsheets, and Internet research. The resources I have developed relate to baseball. Warm Up 1. Computer/Web Work All three teachers--English, Math, Technology--will instruct the students in the following activities: Math Forum/USI - Exploring Data.
MiddleSchool Excel Assignment.