
Universal JSON-opener for Quandl in PowerBI and Excel/Power Query – The BIccountant. Today I discovered JSON (…confess) and Quandl.
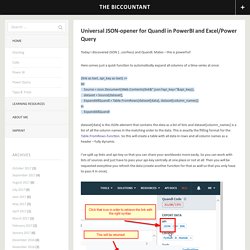
Mates – this is powerful! Here comes just a quick function to automatically expand all columns of a time-series at once: (link as text, api_key as text) => let Source = Json.Document(Web.Contents(link&”.json? Api_key=”&api_key)), dataset = Source[dataset], ExpandAllQuandl = Table.FromRows(dataset[data], dataset[column_names])in ExpandAllQuandl dataset[data] is the JSON-element that contains the data as a list of lists and dataset[column_names] is a list of all the column names in the matching order to the data. I’ve split up links and api-key so that you can share your workbooks more easily. Quandl is fantastic: You just register once, get your api-key & it’s free for so many sources! How I whish I had more time (toolbox looking great in my imagination, seeing incremental loads, custom aggregations, user defined parameters (yet still only in Excel…)… ;.-( ). 5 Very Useful Text Formulas - Power Query EditionThe Ken Puls (Excelguru) Blog. Years ago I published an article on my site called Five Very Useful Functions For Working With Text.
This post is alternative version, but with a twist. I bring you 5 Very Useful Text Formulas - Power Query Edition. Split a String in Excel. Home » Excel-Formulas » Split-String-in-Excel This page describes how to split a string in Excel using Excel's Left, Mid and Right functions.
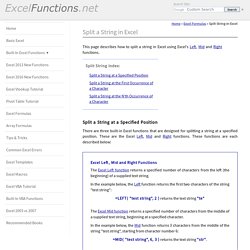
Split a String at a Specified Position There are three built-in Excel functions that are designed for splitting a string at a specified position. These are the Excel Left, Mid and Right functions. These functions are each described below: Non Repeating Random Numbers in Excel. Microsoft Excel have provided two primary functions for generating random numbers, namely RAND() and RANDBETWEEN().
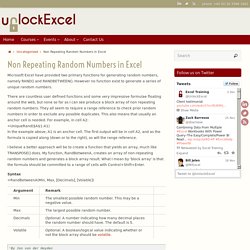
However no function exist to generate a series of unique random numbers. There are countless user defined functions and some very impressive formulae floating around the web, but none so far as I can see produce a block array of non repeating random numbers. They all seem to require a range reference to check prior random numbers in order to exclude any possible duplicates. This also means that usually an anchor cell is needed. Real Statistics Using Excel. Advanced Formula #1 - Generate random numbers between two numbers without duplicates - Mr Spreadsheets. Here is a method that uses two columns to generate a unique list of random whole numbers between two numbers.
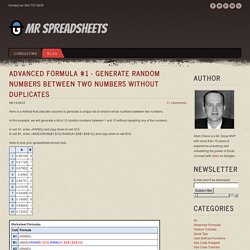
In this example, we will generate a list of 10 random numbers between 1 and 10 without repeating any of the numbers. In cell A1, enter =RAND() and copy down to cell A10.In cell B1, enter =INDEX(ROW($1:$10),RANK(A1,$A$1:$A$10)) and copy down to cell B16. Here is how your spreadsheet should look. Note! Free 2014 Excel Calendar - Blank and Printable Calendar XLS. 2014 Calendar in Excel xls format Free 2014 Excel Calendars Templates.
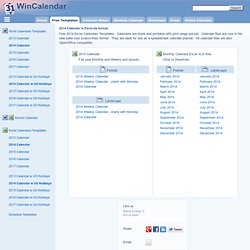
Calendars are blank and printable with print range pre-set. Xnumbers60. Version 6.0 Xnumbers v.6.0 for Excel 2010 (and earlier versions) is an extension of the the original xnumbers.xla v.5.6, still available from the website of Leonardo Volpi, the author of Xnumbers, at Foxes Team for Excel 2000/XP/2003: It has many useful functions and the ability to calculate with up to 250 digits (the errors of standard “double precision” are sometimes intolerable).
It is a great Add-In! If you have installed Office 2007 or 2010, spreadsheets might not calculate correctly with xnumbers.xla prior to v.5.6.3, as in some versions of Excel xPow(2,8) returned 128 instead of 256. Currently undocumented on Leonardo’s website is that the download “v.5.6 Feb 2008” is actually “v.5.6.3 Sept 2008”, which has a fix for the “xPow bug”.
Even though his website warns that it does not support Excel 2007 or Vista, as far as I know the “xPow bug” was the only major problem. My brother John, a highly skilled programmer, has extensively rewritten most of the code in Visual Basic. MultiPrecision_new. XNUMBERS - Multi Precision Floating Point Calculus For EXCEL Home Multi-Precision Computing.
Xnumbers is an Excel addin (xla) that performs multi-precision floating point arithmetic. Perhaps the first package that extends the standard Excel precision from 1 up to 250 significant digits. It is compatible with Windows Excel 2000/XP (*) and consists of a set of more than 300 functions for arithmetic, complex , trigonometric, logarithmic, exponential calculus. All documentation on-line. Index Function List Theory How to store long number. Using Excel statistical functions for trend analysis. Posted on January 26th, 2011 in Charts and Graphs , Excel Howtos , Huis , Learn Excel , Posts by Hui - 52 comments Forecasting using Excel Functions “Todays forecast will be Hot and Humid with a Chance of Snow?”
(Even the experts with big computers get it wrong) In the previous post we looked at Manual Forecasting techniques and how Excel can be used to assist. Excel. Add, Edit, Delete and Run Access Queries with VBA. IntroductionCode to Create a Query or ProcedureCode to Modify a Query or ProcedureCode to Delete a Query or ProcedureCode to Run a Query or ProcedureExamples - Create a select query - Create an action query - Create a parameter query - Modify a query - Delete a query - Run an action query - Run a select query - Run a parameter query - Create a stored procedurePossible ErrorsFurther Reading The focus of this article is to demonstrate how to use ADO/ADOX to manipulate Access objects.

In truth, generally when dealing with Microsoft Access, DAO (Data Access Objects) would be a better object library than than ADO. ADOX, however, is extendible to other databases, not just Microsoft Access. ADOX (Microsoft ActiveX Data Objects Extensions for Data Definition Language and Security ) is an extension to the ADO objects and programming model. ADOX includes objects for schema creation and modification, as well as security. ADOX capabilities extend far beyond what is described in this article. VBA Excel - Run macro automatically when cell value changed (not changed by user) Dynamic Chart Ranges in Excel - How to & Tutorial. Posted on October 15th, 2009 in Charts and Graphs , Excel Howtos - 74 comments We all know that to make a chart we must specify a range of values as input.
But what if our range is dynamic and keeps on growing or shrinking. You cant edit the chart input data ranges every time you add a row. Wouldn’t it be cool if the ranges were dynamic and charts get updated automatically when you add (or remove) rows? Well, you can do it very easily using excel formulas and named ranges. Ofcourse not, there are 2 ways to do this. The easiest way to make charts with dynamic ranges. Modelling Reaction Kinetics in Excel. This spreadsheet demonstrates how you can model reaction kinetics in Excel with the solution of differential equations. Consider this reaction scheme where A and B are reactants, X and Y are catalysts, and k1 and k2 are rate constants. The following coupled differential equations can be derived from the stoichiometry of the chemical reaction scheme. where a(t), b(t), x(t) and y(t) are the concentrations of A, B, X and Y at time t.
How to display a progress bar with a user form in Excel. If you have a Microsoft Visual Basic for Applications macro that takes a long time to finish, you may want to give the user an indication that the macro is progressing correctly. This article describes how to create a progress bar with a user form in Microsoft Excel. Microsoft provides programming examples for illustration only, without warranty either expressed or implied. This includes, but is not limited to, the implied warranties of merchantability or fitness for a particular purpose. This article assumes that you are familiar with the programming language that is being demonstrated and with the tools that are used to create and to debug procedures. Microsoft support engineers can help explain the functionality of a particular procedure.
Create the User Form. Rounding Significant Figures in Excel. How do you tell Excel to round to a specific number of significant figures without having to use exponential notation? This Excel formula will do the trick: =ROUND(value,sigfigs-(1+INT(LOG10(ABS(value))))) value :: the number you wish to round. sigfigs :: the number of significant figures you want to round to. There. Quick and easy. How the formula works: The trick to this formula comes from understanding scientific notation. Let's work backwards from what we want. Statistical Outliers detection in Microsoft Excel worksheet - New York online learning. A bit of theory behind the computation "Outliers" are defined as numeric values in any random data set, which have an unusually high deviation from either the statistical mean (average) or the median value. In other words, these numbers are either relatively very small or too big.
Detecting the outliers in a data set represents a complex statistical problem, with a corresponding variety of different methodologies and computational techniques as described, for example, in the NIST publication [1]. Excel for Business Statistics. This is a webtext companion site ofBusiness StatisticsUSA Site Para mis visitantes del mundo de habla hispana, este sitio se encuentra disponible en español en: Sitio Espejo para América Latina Sitio de los E.E.U.U.
Excel is the widely used statistical package, which serves as a tool to understand statistical concepts and computation to check your hand-worked calculation in solving your homework problems. The site provides an introduction to understand the basics of and working with the Excel. Redoing the illustrated numerical examples in this site will help improving your familiarity and as a result increase the effectiveness and efficiency of your process in statistics.To search the site, try Edit | Find in page [Ctrl + f]. Enter a word or phrase in the dialogue box, e.g. To enter information into a cell, select the cell and begin typing. Using structured references with Excel tables. Structured references make it much easier and more intuitive to work with table data when you are using formulas that reference a table, either portions of a table or the entire table.
They are especially useful because table data ranges often change, and the cell references for structured references adjust automatically. Excel Resources. VBA and Excel. AJP Excel Information. Charting Examples Excel Charting techniques, solutions and examples Chart Pattern Fill PowerPoint Add-In for applying Pattern fills to charts, tables and shapes in PowerPoint 2007 Ratio Plotarea Maintain plotarea ratios Dashboards A collection of tips compiled by guest poster Ceri Williams. Jon's Excel Charts and Tutorials - Index.