
Untitled. What are discounted cash flow and the time value of money?

Discounted cash flow DCF is an application of the time-value-of-money concept—the idea that money to be received or paid at some time in the future should be treated as having less value, today, than an equal amount actually received or paid today. The DCF calculation determines the value appropriate today (the present value) for the future cash flow.
The term "discounting" is used because the DCF present value is always lower than the cash flow future value. In modern finance, time-value-of-money concepts play a central role in decision support and planning. When investment projections or business case results extend more than a year into the future, professionals trained in finance usually want to see cash flows presented in two forms, in discounted terms and in non discounted terms. This article defines, explains, and illustrates the following terms and concepts with example calculations: Opportunity. Untitled. 4th Edition ISBN 978-1-929500079 Published by Solution Matrix Limited 2015 Handbook, tutorial, working templates.

Complete coverage of cash flow and financial statement metrics. New in 4th Edition: Analyst Workbench & Chairman's View It's about time. Financial Metrics Pro IV™ is the proven and trusted system that saves you hours or days of tedious spreadsheet programming and lowers the risk of errors at the same time. Onscreen explanations help you build financial models quickly and easily. Comprehensive Handbook Look-up reference for over 160 individual cash flow and financial statement metrics. Teaching Tutorial For those working with IRR, NPV, Working Capital, or any of over 160 other metrics for the first time, Financial Metrics Pro V4 is a clear, in-depth textbook on metrics meaning and usage. Compare spreadsheet formulas to algebraic definitions. 10 ways to present variance analysis reports in Excel - PakAccountants.com.
Whether it is daily life thing or any day at work, we are always comparing to see whats good and what is not so good.
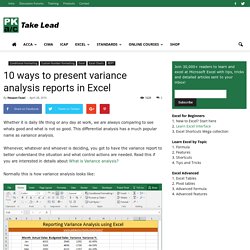
This differential analysis has a much popular name as variance analysis. Whenever, whatever and whoever is deciding, you got to have the variance report to better understand the situation and what control actions are needed. Read this if you are interested in details about What is Variance analysis? Normally this is how variance analysis looks like: Not much a of a fan like this… right?
Corporate and Project Finance Modeling Content. This site includes exercises, model examples, and case studies and is integral to the book.
It contains hundreds of customized exercises; many template project finance, corporate finance, and acquisition models; and a number of featured completed models of business enterprises in a wide variety of different industries. In addition, you can download special utilities to read PDF files into Excel, to make automated waterfall charts, to automatically color cells linked to different sheets, to create a table of contents with hyperlinks, and many other things. Exercises and complete models are arranged by chapter, meaning that you can follow along the discussion in each chapter with different Excel files. You can also see how the principles are applied in actual situations. In opening each file you can find a link to a video explanation that explains the modeling process. Chapter 4: The Structure of Alternative Financial Models. Excel summary worksheet. 889 × 341 - datawright.com.au 723 × 341 - datawright.com.au.
Excel summary worksheet. Excel summary worksheet. Excel summary worksheet. Excel summary worksheet. Excel summary worksheet. What are the best practices when modelling in Excel? - Quora. Excel summary worksheet. Macros for Automatically Implementing Modeling Best Practices. Posted on November 29th, 2012 in Financial Modeling , VBA Macros - 7 comments This article is written by Myles Arnott from Excel Audit In the first part on our Modeling Best Practices series, we learned 5 best practices to follow.
This article shows how to automatically implement the best practices using macros. Quick Re-cap on Modeling Best Practices Make cell content and cell purpose visually identifiable at all times In the first article I highlighted the fact that the content and purpose of every cell should be easily identifiable to the user at all times. Variance Analysis in Excel - Making better Budget Vs Actual charts - PakAccountants.com.
Weather it is about daily life or business, we almost all the time in our minds comparing the actual results with our plans.
Though we can talk numbers and percentages but the way charts tell the stories is unbeatable. However, variance charts are often tricky as you have three things to report: planned figuresactual figuresvariances i.e. the difference between plan and actual figures which can either be favourable and unfavourable. Charting three elements together is not a problem at all, the problem is to convey the story in the most meaningful possible way which boils down to the way we present it. Three Key Principles of Visual Design in Excel. Tagged as: charts, formatting, visualization To learn more about Excel, go to the organized listing of all my Excel tutorial posts or review the most popular Excel books on Amazon Visual Design is a concept that many people don’t think about when using Excel.
However, given how much Excel’s visual display capabilities have improved over the years, the concept is becoming more and more important. There are a number of great books on Visual Design and they all have very similar themes. The following post is intended to summarize these themes with three major principles. Remove Non-Essential Components In his book, the Visual Display of Quantitative Information, Edward Tufte coined the phrase chartjunk, which represents anything in a chart that is not required to understand the components of your data. Tactical Uses: Emphasize Important Data Every output you create gives you a chance to tell a story. Design with a User Focus.