
Top Excel Dashboards Sites. Excel Dashboards - Templates, Tutorials, Downloads and Examples. Dashboard reports allow managers to get high-level overview of the business.
Excel is an excellent tool to make powerful dashboards that can provide analysis, insight and alert managers in timely manner. In this page (and others linked here) you can find a lot resources, templates, tutorials, downloads and examples related to creating dashboards using Microsoft Excel. Use the below links to quickly access various sections of this page. What is a Dashboard? Dashboard reports allow managers to get high-level overview of the business and help them make quick decisions. How to Make a Dashboard? You can create dashboards using a lot of different tools. Read the following tutorials to understand how to make Excel Dashboards: Creating KPI Dashboards in Excel [6 part tutorial] In this 6 part tutorial, you will learn how to create a KPI (Key Performance Indicator) Dashboard ground up using MS Excel. Customer Service Dashboard in Excel [4 part tutorial] Excel Dashboards. Excel Dashboards. Excel Dashboards, Templates and Business Software.
Excel Dashboard Software. DIY Excel Dashboard. KPI Dashboard in Excel- Video Tutorial & Demo. Introduction Showing Excel Dashboard Linking to Software. How To... Create a Basic KPI Dashboard in Excel 2010. Drilling into details in an Excel Dashboard. Changing Chart Types in an Excel Dashboard. Excel Dashboard Templates - Your Excel Dashboard Template Resource. Project Management Dashboard, Project Status Report using Excel - Templates and Downloads. Posted on October 6th, 2009 in Charts and Graphs , Featured , Learn Excel - 41 comments This is the last installment of project management using excel series.
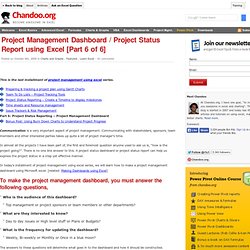
Preparing & tracking a project plan using Gantt ChartsTeam To Do Lists – Project Tracking ToolsProject Status Reporting – Create a Timeline to display milestonesTime sheets and Resource managementIssue Trackers & Risk ManagementPart 6: Project Status Reporting – Project Management DashboardBonus Post: Using Burn Down Charts to Understand Project Progress Communication is a very important aspect of project management. Communicating with stakeholders, sponsors, team members and other interested parties takes up quite a bit of project manager’s time. In almost all the projects I have been part of, the first and foremost question anyone used to ask us is, “how is the project going?”. In today’s installment of project management using excel series, we will learn how to make a project management dashboard using Microsoft excel. What next? Free Excel Dashboard Template.
Dashboards are a much maligned tool in web analytics. Many can be only politely described as reports, whereas data pukes is a more accurate term. But I believe there is a gap between these reports filled with data and the minimalistic Actionable Dashboards created by Avinash, a gap that can be filled by useful performance dashboards. Business owners need information to make decisions. Some of them want to view data, not just be told what the data means and what their decision should be. But web analytics tools contain too much data and end up being useless to the business owner as they can’t get the information they need. A well designed dashboard meets this need (automated so minimal resources are required to update). These Excel Dashboard templates are designed to provide this level of data for business owners. Context – each metric is referenced against a comparison periodTrend – each metric is trended for up to 15 periodsSegmentation – up to five segments can be applied to the data.
The One Page Report an Excel Dashboard and Scorecard. The One Page Report (3.5 mins) Build your own Excel, iPhone or iPad Dashboards. Excel Dashboards. Project Management Dashboard, Project Status Report using Excel - Templates and Downloads. Working with Pivot Tables in Excel 2010 - Part 1. Working with Pivot Tables in Excel 2010 - Part 2. How to Dynamically Change Excel Chart Data. SharePoint as a Business Intelligence Platform- Creating Dashboards in PerformancePoint Services. Build a KPI Dashboard in 5 minutes. Interactive Dashboard in Excel Demo. Dashboards in Excel. Digital Dashboards Using Microsoft Excel and VBA. Excel Dashboard Basics: Drop down menus for Interactive Charts and Dashboards. How to Create an Interactive Excel Pivot Chart.