
Les classes dans Excel avec la fonction Fréquence. Cet article présente l’utilisation de la fonction Fréquence dans le logiciel Excel.

Cette fonction permet de répartir les valeurs en classes. Autrement dit, notre fichier Excel contient 96 départements, chacun ayant une donnée associée, il s’agit du montant des taxes communales en euros par habitant en 2007. L’objectif est de répartir les départements selon le montant de la taxe payée dans 10 classes. La première étant inférieure à 100 euros, la seconde entre 100 et 200 euros et ainsi de suite jusqu’à 1 000 euros.
Les classes forment un couple représenté de la manière suivante [limite basse; limite haute], dans notre cas cela donnerait donc [100;200]. Vous pouvez également consulter la vidéo : Dans un premier temps, il faut créer les classes que nous souhaiterons appliquer par la suite. Maintenant que mes classes sont prêtes, je sélectionne la plage dans laquelle les résultats devront apparaître (rectangle de sélection vert sur la capture ci-dessous) Data Analysis Archives - ExcelDemy.com. I was thinking in how many ways I can create a frequency distribution table in Excel.
I have found 6 ways. In addition I have created an Excel Template [with love I named it as FreqGen] to make frequency distribution… Continue Reading We shall discuss in this section about exporting data in Excel. You can convert your Excel workbook in different formats like csv, txt, PRN, and many more. Converting Excel workbook to text format When you choose File ➪ Save as and… Continue Reading. Power View in HTML5 - Excel. Welcome to the HTML5 version of Power View. As Power View moves to HTML5, you can view it on more devices, operating systems, and browsers. See the list of supported operating systems, devices, and browsers for details. This version gives you a look at Power View in HTML5. We’ll release updated versions while development continues, so we can continue to improve Power View and increase the list of supported features.
Because Power View in HTML5 is a work in progress, some visualizations may not work as expected. See What's new in Power View in HTML5. Click this icon in the lower-right corner to try this version: To give feedback, tap the tool and smiley face in the lower-right corner, and tap Send Feedback to open the new feedback form. More in this article Supported operating systems or devices, and browsers. Download Microsoft Power Query pour Excel from Official Microsoft Download Center.
Sélectionnez une langue :
Power Up Excel with 10 Add-Ins to Process, Analyze & Visualize Data Like a Pro. Vanilla Excel is powerful, precise, and performs miracles with data.
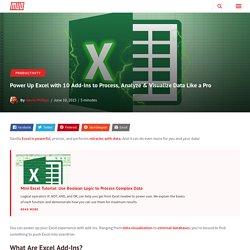
And it can do even more for you and your data! Mini Excel Tutorial: Use Boolean Logic to Process Complex Data Mini Excel Tutorial: Use Boolean Logic to Process Complex Data Logical operators IF, NOT, AND, and OR, can help you get from Excel newbie to power user. We explain the basics of each function and demonstrate how you can use them for maximum results. People Graph. Digital Intelligence I am using an Windows 8.1 HP Envy 17TS, 16GB, i7-4710MQ , Office Home & Student (64-Bit Version) PC.
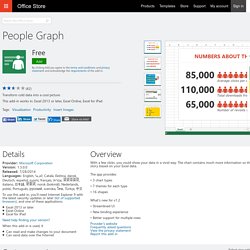
This Office App is good for single or doublesheet workbooks. Problems were encountered when incorporating it into a 10MB excel workbook (multiple data sheets, pivot sheets, and 1 Print Sheet with non printible reference data)) - The PDF export renders incorrectly on the print sheet as the People Graph itself exhibited GUI errors (getting stuck on top when scrolling and unable to click on my cells, taking more than 10 seconds to 'Edit'. I will give this good ratings for singlesheet workbooks for doing infographic type stuff, but am disappointed that the app breaks down on busy workbooks as I was hoping to illustrate (and automate) top 6 without converting to image. Ways to improve this Office App a.
B. C. Bubbles. Power BI Tiles. Nice idea - exciting even, but I am having a problem in accessing my Power Bi Account.
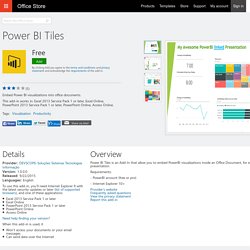
Error authenticating with PowerBI: AADSTS65001: No permission to access user information is configured for 'aaf214cc-8013-4b95-975f-13203ae36039' application, or it is expired or revoked. Databurst for Excel. Free Excel Templates and Spreadsheets.
Excel templates are a great way to increase your productivity. They allow you to do awesome things with Excel even if you only have a basic understanding of spreadsheets. You can use templates created by Microsoft by opening Excel and going to File > New. You can also download 100's of templates professionally designed by Jon Wittwer and his team at Vertex42.com. This page lists our most popular spreadsheet templates. If you are looking for solutions specifically for your business, see our Business Templates page.
Advertisement Featured Excel Templates A very good alternative to Microsoft Project if you need a simple project schedule. Analyze fixed-rate and adjustable-rate mortgages, print an amortization schedule, include extra payments. The ultimate money management spreadsheet! Power View : explorer, visualiser et présenter vos données - Excel. Cet article a été traduit automatiquement, voir l’avertissement. Vous pouvez consulter la version en anglais de cet article ici. Cette fonctionnalité n’est pas disponible dans Office sur un PC Windows RT. Power View et Power Pivot sont disponibles dans les éditions Office Professionnel Plus et Office 365 Professionnel Plus, ainsi que l’édition autonome d’Excel 2013.
Microsoft Power BI. Complément PowerPivot - Excel.