
Excel Unusual. Basic Excel - 7 Buttons You Must Add to your Quick Access Toolbar - Computergaga Blog. In the latest version of Excel it has become your responsibility (if you choose to) to create your own toolbar, and in our basic Excel series we show you how..

The Quick Access Toolbar at the top of your screen begins with just the Save, Undo and Redo buttons. If you require fast access to any other Excel commands you are able to add them yourself. You can add almost any functionality to the toolbar including those not found on the Ribbon. As part of our basic Excel series, this post explores 5 incredible additions to the toolbar that are sure to improve the way you work. Not sure how to add buttons to the Quick Access Toolbar? 1. This wizard was how you created PivotTables in previous versions but then it was removed from Excel 2007. Learning Excel - Awesome Date Functions in Excel - Computergaga Blog. Do you want to advance your skills by learning Excel?

Performing date calculations can sometimes be troublesome. Trying to calculate the number of working days between two dates, or automatically finding the date in two months’ time is not as straight forward as formulas with general numbering can be. Fortunately Excel has a full repertoire of fantastic date functions. Here are five of the best. The TODAY function is used for a lot of good date calculation work. It is written as below; No information is needed by this function as it gets what it needs from your computer. Using the Hyperlink Function in Excel - Computergaga Blog.
Hyperlinks can be used to link to other sheets, webpages or other files such as PDF’s from your Excel spreadsheet.

If you are creating hyperlinks for many records though this will take a long time to set them up. Excel provides a HYPERLINK function for creating hyperlinks in our spreadsheets. The real power behind this function is that it can be used to create dynamic hyperlinks. We can create conditional hyperlinks by nesting them within an IF function, or create hyperlinks that can find the address to link to themselves by embedding Lookup or Text functions within them. This helps us to create automated and error resistant spreadsheets. The HYPERLINK Function The HYPERLINK function is written as; =HYPERLINK(link_location, [friendly_name]) Create a Histogram in Excel - Computergaga Blog. A Histogram is used in statistics to graphically represent the distribution of data.

It looks like a column chart with each column representing an interval (bin), and the column height representing the frequency that it appears. Essentially the graph groups numbers into intervals (bins) and displays how often they appear. The graph then beautifully illustrates how the sets of numbers are distributed. For example, the histogram below displays the distribution of school grades from 20 pupils among different intervals.
Create a Scrollable Chart for your Excel Dashboards - Computergaga Blog. Creating a scrollable chart is a great trick for enhancing the functionality of your Excel dashboards.
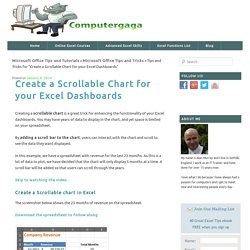
You may have years of data to display in the chart, and yet space is limited on your spreadsheet. By adding a scroll bar to the chart, users can interact with the chart and scroll to see the data they want displayed. In this example, we have a spreadsheet with revenue for the last 23 months. As this is a lot of data to plot, we have decided that the chart will only display 5 months at a time.
A scroll bar will be added so that users can scroll through the years. Animate a Chart in Excel - Computergaga Blog. Creating Multiple Dependent Drop Down Lists - Computergaga Blog. Drop down lists can be created in Excel to assist with data entry and to prevent potential typos and misspellings.
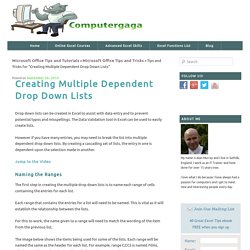
The Data Validation tool in Excel can be used to easily create lists. However if you have many entries, you may need to break the list into multiple dependent drop down lists. By creating a cascading set of lists, the entry in one is dependent upon the selection made in another. Create a Battery Chart in Excel - Computergaga Blog. Create a battery chart in Excel just like you see on your smartphone, tablet device or even PC.
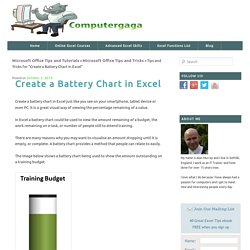
It is a great visual way of viewing the percentage remaining of a value. In Excel a battery chart could be used to view the amount remaining of a budget, the work remaining on a task, or number of people still to attend training. There are many reasons why you may want to visualise an amount dropping until it is empty, or complete. Make a Thermometer Chart in Excel. A thermometer chart is used to track progress towards a target or goal.
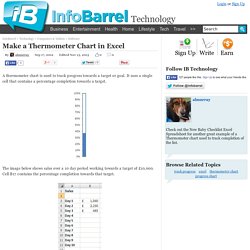
It uses a single cell that contains a percentage completion towards a target. The image below shows sales over a 10 day period working towards a target of £10,000. Cell B17 contains the percentage completion towards that target. In Cell Charting. I discovered a while ago that you can create a Shape from a user-defined function.
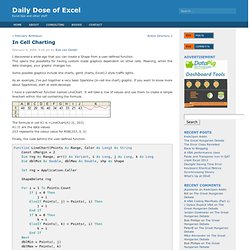
This opens the possibility for having custom made graphics dependent on other cells. Meaning, when the data changes, your graphic changes too. Some possible graphics include line charts, gantt charts, Excel12 style traffic lights. As an example, I’ve put together a very basic Sparkline (in-cell line chart) graphic. If you want to know more about Sparklines, start at ewbi.develops.