
Create a topic. E90E50charts - Excel Charts Gallery. Obama's 2014 budget proposal.
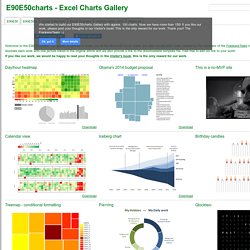
Combine pie and xy scatter charts - Advanced Excel Charting Example. Few days ago, we learned how to create a pie+donut combination chart to visualize polls around the world in 2014.
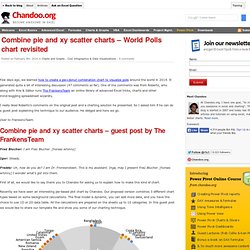
It generated quite a bit of interesting discussion (47 comments so far). One of the comments was from Roberto, who along with Kris & Gábor runs The FrankensTeam an online library of advanced Excel tricks, charts and other mind-boggling spreadsheet wizardry. I really liked Roberto’s comments on the original post and a charting solution he presented. So I asked him if he can do a guest post explaining the technique to our audience. He obliged and here we go. Over to FrankensTeam. Combine pie and xy scatter charts – guest post by The FrankensTeam Fraü Blucher: I am Fraü Blucher. Igor: Steady. Freddy: Uh, how do you do? Consuming SSRS data in Excel 2007. OData. A few weeks ago, when I was playing around with the new WebService() function in Excel 2013, I was disappointed to learn that it didn’t work with services that require authentication – a pretty big limitation in my opinion – so, for example, it meant I couldn’t use it to import data from the Azure Marketplace into Excel.
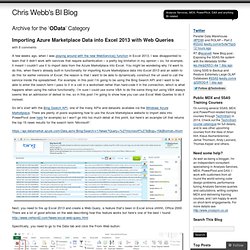
You might be wondering why I’d want to do this, when there’s already built-in functionality for importing Azure Marketplace data into Excel 2013 and an addin to do this for earlier versions of Excel; the reason is that I want to be able to dynamically construct the url used to call the service inside the spreadsheet. For example, in this post I’m going to be using the Bing Search API and I want to be able to enter the search term I pass to it in a cell in a worksheet rather than hard-code it in the connection, which is what happens when using the native functionality. Specifically, you need to go to the Data tab and click the From Web button: Query Table with Excel as Data Source. Query tables can be of great help if you need to extract particular data from a data source It represents a worksheet table built from data returned from an external data source, such as an SQL server or a Microsoft Access database.

The QueryTable object is a member of the QueryTables collection However, it need to be SQL server or a Microsoft Access database always. You can use CSV file or our fellow Microsoft Excel spreadsheet as a data source for QueryTable Here is one such example, which extracts data from MS Excel sheet. Installing Data Explorer Preview & Demo with IMDB Data. I can’t believe it has been over a year since I posted about Data Explorer in my post Installing Data Explorer Desktop Client.

That was covering the initial release of the client plugin that used the cloud based service from SQL Azure Labs. Now there has been a considerable amount of work done and there is a public preview of the new COM Add-In you can download and use in Excel. Let’s take a look at the requirements: Systems RequirementsSupported Operating Systems: Windows 8, Windows 7, Windows Vista, Windows Server 2008requires .NET 3.5 SP1 or greaterOffice 2013 or Office 2010 SP1 You can download the 32 or 65-bit version of this from the Microsoft Office area – Download “Data Explorer”. Here you can see the download loading in Excel 2010. Here is the add-in being displayed in the ribbon along with the options that are available. Version: 1.0.3207.2 (published 2/25/2013) Installing Data Explorer Desktop Client. Posted by denglishbi on December 19, 2011 In this post I will go over the installation of the new “Data Explorer” client tool that is available to download as an Office plugin providing you the ability to launch the tool from within Excel.
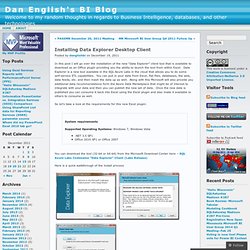
Data Explorer is a new tool available in the SQL Azure Labs in the cloud that allows you to do some self-service ETL capabilities. You can pull in your data from Excel, flat files, databases, the web, data feeds, etc. and then mash the data up as well. DAX Formulas for PowerPivot - Books24x7. Excel Waterfall Charts (Bridge Charts) Waterfall charts are commonly used in business to show how a value changes from one state to another through a series of intermediate changes.
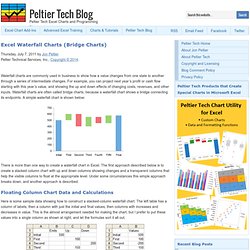
For example, you can project next year’s profit or cash flow starting with this year’s value, and showing the up and down effects of changing costs, revenues, and other inputs. How to Make Better Pie Charts with On-Demand Details The Excel Charts Blog. This article goes much against conventional wisdom about pie charts (and doughnut charts) by answering these two simple questions: Can we use a large number of categories in pie charts?
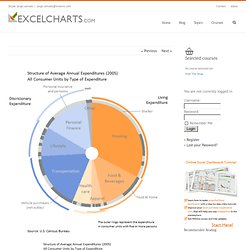
(Yes, we can.)Can we make a productive use of the apparently useless doughnut chart? (Yes, we can.) Disclaimer (Sort of…) Let me start by declaring this: I believe that the analysis of simple proportions is, by its very nature, very limited. A circular chart is poor because the underlying message is poor. Pie chart belong to the media and to some simple presentations. The part-of-whole issue That said, one must recognize that proportions are so pervasive and hard-wired into our brain that escaping them is almost impossible. A circular chart conveys perfectly the idea of part-of-whole relationship. As I wrote in my previous post on loss aversion, each chart answers a question from a different perspective. The limit of 4 to 6 categories in pie charts That’s is wrong or, at the very least, very incomplete. AJP Excel Information. Charting Examples Excel Charting techniques, solutions and examples Chart Pattern Fill PowerPoint Add-In for applying Pattern fills to charts, tables and shapes in PowerPoint 2007 Ratio Plotarea Maintain plotarea ratios Dashboards.
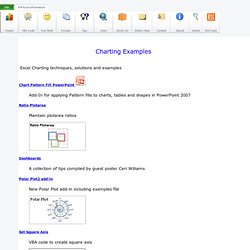
Pie radius.