
The Excel Chart Series Formula. Introduction to the Series Formula An individual series' data ranges are highlighted when that series is highlighted (see below).
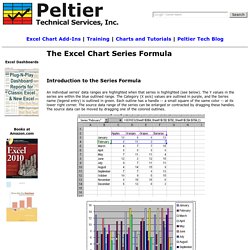
The Y values in the series are within the blue outlined range. The Category (X axis) values are outlined in purple, and the Series name (legend entry) is outlined in green. Each outline has a handle -- a small square of the same color -- at its lower right corner. The source data range of the series can be enlarged or contracted by dragging these handles. In the screen shot above, note that information about the series is displayed above the worksheet. =SERIES(Sheet1! This formula can be broken up into four elements as follows: =SERIES([Series Name],[X Values],[Y Values],[Plot Order]) Note: Bubble Charts require one additional range of data, for the sizes of the bubbles. =SERIES([Series Name],[X Values],[Y Values],[Plot Order],[Bubble Size Values]) In our example: =SERIES(Sheet1! Sheet1!
Zoom on Excel Charts Macro. When you have a dashboard with small panel charts it is nice to be able to zoom in on the charts to see the trends better.
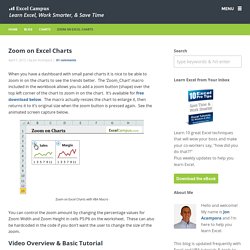
The ‘Zoom_Chart’ macro included in the workbook allows you to add a zoom button (shape) over the top left corner of the chart to zoom in on the chart. It’s available for free download below. The macro actually resizes the chart to enlarge it, then returns it to it’s original size when the zoom button is pressed again. See the animated screen capture below. Can Excel charts be interactively zoomed and panned? Stock Chart with Scroll and Zoom. Stock charts come in various shapes.
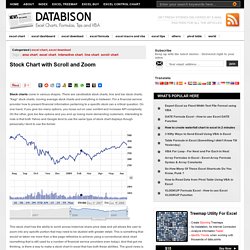
There are candlestick stock charts, line and bar stock charts, “Kagi” stock charts, moving average stock charts and everything in between. For a financial service provider how to present financial information pertaining to a specific stock can a critical question. On one hand, if you give too many options, you loose out on user comfort and increase API complexity. On the other, give too few options and you end up losing more demanding customers. Interesting to note is that both Yahoo and Google tend to use the same type of stock chart displays though personally I tend to use the former. This stock chart has the ability to scroll across historical share price data and yet allows the user to zoom into any specific portion that may need to be studied with greater detail. The stock chart above that has two controls – the first one allows to you move across a timeline and view changes in share price and volume over the complete time horizon. 1. 2. 3. 4.
Keyboard Shortcuts Everybody Should Know. Ctrl + Shift + Enter: Excel Array Formulas #01: Review Formula Basics (15 Important Examples) VLOOKUP function Beginner to Advanced 26 Examples (Excel VLOOKUP WEEK Video #1) Use the Excel Vlookup Function across Multiple sheets. Excel Tips - Tip#34: Scrolling Charts. Powerful tool for zooming and scrolling excel chart. Zoom on Excel Charts Macro. Can Excel charts be interactively zoomed and panned? How to Add Zoom & Scroll to an Excel Chart. Excel charts containing large amounts of data prevent readers for easily reading small segments.
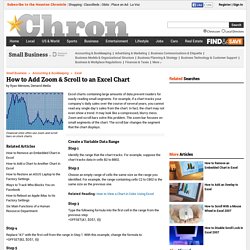
For example, if a chart tracks your company's daily sales over the course of several years, you cannot read any single day's sales from the chart. In fact, the chart may not even show a trend. It may look like a compressed, blurry mess. Zoom and scroll bars solve this problem. Range Filter Slider Control in Microsoft Excel. How to use the Microsoft Slider Control to implement a range filter input feature in Microsoft Excel Almost every Excel workbook needs some way of user interaction (maybe except for the Excel models serving solely as the reporting front-end of a database).
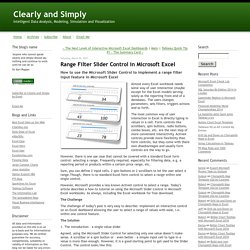
The users changes parameters, sets filters, triggers actions and so forth. The most common way of user interaction in Excel is directly typing in values in a cell. Form controls like scrollbars, spin buttons, radio buttons, combo boxes, etc. are the next step of more convenient interactivity. ActiveX controls provide more flexibility than form controls, but they come with there own disadvantages and usually form controls are the way to go.
However, there is one use case that cannot be covered with a standard Excel form control: selecting a range. Sure, you can define 2 input cells, 2 spin buttons or 2 scrollbars to let the user select a range.Though, there is no standard Excel form control to select a range within one single control. 1.