
Data visualization. Free data. Multiple regression analysis. Free Statistical Software. Environmental Criminology Research Inc. - Geographic Profiling - Crime Analysis » Rigel Analyst. CrimeStat Spatial Statistics Program - Version 3.0. Introduction to Principal Component Analysis (PCA) - Laura Diane Hamilton. Principal Component Analysis (PCA) is a dimensionality-reduction technique that is often used to transform a high-dimensional dataset into a smaller-dimensional subspace prior to running a machine learning algorithm on the data.

When should you use PCA? It is often helpful to use a dimensionality-reduction technique such as PCA prior to performing machine learning because: Reducing the dimensionality of the dataset reduces the size of the space on which k-nearest-neighbors (kNN) must calculate distance, which improve the performance of kNN. Reducing the dimensionality of the dataset reduces the number of degrees of freedom of the hypothesis, which reduces the risk of overfitting. Most algorithms will run significantly faster if they have fewer dimensions they need to look at. What does PCA do? Principal Component Analysis does just what it advertises; it finds the principal components of the dataset. Can you ELI5? Let’s say your original dataset has two variables, x1 and x2: Do Faster Data Manipulation using These 7 R Packages. Introduction Data Manipulation is an inevitable phase of predictive modeling.
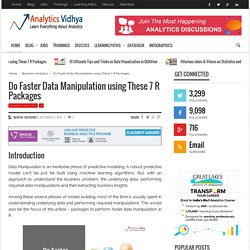
A robust predictive model can’t be just be built using machine learning algorithms. But, with an approach to understand the business problem, the underlying data, performing required data manipulations and then extracting business insights. Among these several phases of model building, most of the time is usually spent in understanding underlying data and performing required manipulations. This would also be the focus of this article – packages to perform faster data manipulation in R. Data Preprocessing Tools. Advance Macintosh Data Recovery Software and macintosh file retrieval tool for deleted or formatted apple macintosh hard drives.
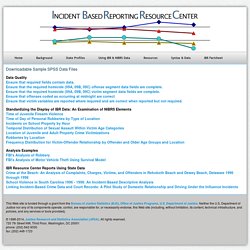
Mac Recovery Software is the most advanced Mac File Recovery application that recovers data from formatted, deleted or corrupted Mac partitions or External mac hard drives. Data: Querying, Analyzing and Downloading: The GDELT Project. SAS Tutorials. Downloadable Sample SPSS Data Files. Downloadable Sample SPSS Data Files Data QualityEnsure that required fields contain data.Ensure that the required homicide (09A, 09B, 09C) offense segment data fields are complete.Ensure that the required homicide (09A, 09B, 09C) victim segment data fields are complete.Ensure that offenses coded as occurring at midnight are correctEnsure that victim variables are reported where required and are correct when reported but not required.
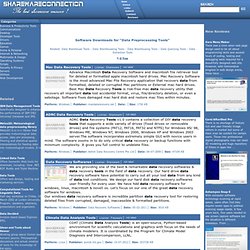
Top 50 Free Statistical Software. Free Statistical Software - Open Source Software & Freeware - Research Guides at University of Kansas Medical Center. VassarStats: Statistical Computation Web Site. Interactive Statistical Calculation Pages. Flexdashboard: Easy interactive dashboards for R. DataCracker - Login. The R Trader » Blog Archive » BERT: a newcomer in the R Excel connection. A few months ago a reader point me out this new way of connecting R and Excel.

I don’t know for how long this has been around, but I never came across it and I’ve never seen any blog post or article about it. So I decided to write a post as the tool is really worth it and before anyone asks, I’m not related to the company in any way. BERT stands for Basic Excel R Toolkit. It’s free (licensed under the GPL v2) and it has been developed by Structured Data LLC. At the time of writing the current version of BERT is 1.07.
In this post I’m not going to show you how R and Excel interact via BERT. How do I use BERT? My trading signals are generated using a long list of R files but I need the flexibility of Excel to display results quickly and efficiently. Use XML to build user defined menus and buttons in an Excel file.The above menus and buttons are essentially calls to VBA functions.Those VBA functions are wrapup around R functions defined using BERT. Prerequisite Step by step guide You’re done! Datasearch. Hoaxy. International statistics: Compare countries on just about anything! NationMaster.com. A Research Engine. Statistical Organizations. Numerical Data Search.
Uk. A Periodic Table of Visualization Methods. Plot Digitizer. Zone Control Charts. Brueggemann06. Programs to Compute Distribution Functions and Critical Values for Extreme Value Ratios for Outlier Detection. Ac1951 23 636 13353. SEMATECH e-Handbook of Statistical Methods. Average Annual Percent Change (AAPC) — Joinpoint Help System 4.3.1.0. While Joinpoint computes the trend in segments whose start and end are determined to best fit the data, sometimes it is useful to summarize the trend over a fixed predetermined interval.
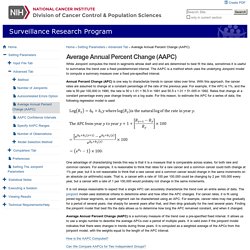
The AAPC is a method which uses the underlying Joinpoint model to compute a summary measure over a fixed pre-specified interval. Annual Percent Change (APC) is one way to characterize trends in cancer rates over time. With this approach, the cancer rates are assumed to change at a constant percentage of the rate of the previous year. For example, if the APC is 1%, and the rate is 50 per 100,000 in 1990, the rate is 50 x 1.01 = 50.5 in 1991 and 50.5 x 1.01 = 51.005 in 1992. D3.js. GSD Kirkwood TBL dispersion 1979. Geometric standard deviation. In probability theory and statistics, the geometric standard deviation describes how spread out are a set of numbers whose preferred average is the geometric mean. For such data, it may be preferred to the more usual standard deviation. Note that unlike the usual arithmetic standard deviation, the geometric standard deviation is a multiplicative factor, and thus is dimensionless, rather than having the same dimension as the input values.
Definition[edit] If the geometric mean of a set of numbers {A1, A2, ..., An} is denoted as μg, then the geometric standard deviation is Derivation[edit] If the geometric mean is. How To Compute a Composite Variable in SPSS. How to Use SPSS to Create a Graph of Demographic Characteristics. Manuali di Statistica. Lamberto Soliani.

SEER*Stat Tutorials - Step 1: Calculating Age-adjusted Rates.