Weightoftheunion2012-anytimefitness-sm.jpg (740×4983) Fat or Fiction: Nutritional Values Depicted as Food-Based Infographics. Infographic: A Cheat Sheet For Grilling Out. It’s surprisingly easy to cook a single piece of meat perfectly every time. If you can’t eyeball it, you can simply use a thermometer. But what can get quite a bit more difficult is juggling a few different proteins--bone-in chicken breasts, brats, and burgers--on a jam-packed grill for a bunch of friends.
Click to enlarge. Luckily, this infographic by Column Five Media makes grilling as easy as looking at infographics. Michelin-star-restaurants.jpg (750×3464) See Mix Drink: Cocktails. The See Mix Drink Cocktail Guide is a fabulous infographic drink recipe book from Brian D.
Murphy (@murph_e). Currently available for about $10 on Amazon.com, it’s on my wish list. Featured on GQ.com back in October when it was released, I have been totally remiss by not posting about it until now. (My apologies Brian!) Have you tried mixing a Mojito? The GQ.com feature has the designs for ten of the recipes from the book. One thing I would suggest to improve the visualization design style is to combine the key and the ingredient portions. Thanks to Brian for sending in the link (back in October!) The Only Chart You Need To Mix A Proper Cocktail. We’d been trying to complete a chart of cocktails for over a year.
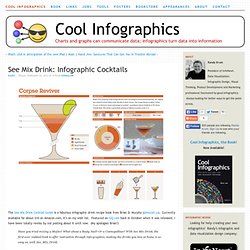
It’s sorta been Pop Chart Lab’s white whale. This journey started, as every PCL chart does, with a bunch of research dumped into Excel. In December 2010, we compiled a document of nearly 200 cocktails broken down by ingredients. Then we moved into OmniGraffle. In our first attempt, we grouped the spirits, wines, liqueurs, cordials, etc., and then started drawing lines connecting each ingredient to the appropriate cocktail. We could tell right away this likely wasn’t going to work. Convinced this wasn’t going to work, we put the idea on the shelf for a few months. Our breakthrough here was putting the chocolates in the center, the candy bars in a ring around the outside, and then the other ingredients at the top and bottom. The Miraculous, Magical, Magnificent History Of Beer [Infographic]
Beer is in a renaissance.
![The Miraculous, Magical, Magnificent History Of Beer [Infographic]](http://cdn.pearltrees.com/s/pic/th/magnificent-infographic-25342123)
Fueled by small craft manufacturers, brewers are reassessing the confines of classic stouts and IPAs. And with virtually no limitations on what can be added to beer (unlike most wines, which are confined strictly to the artful manipulation of grapes), the sheer variety of what’s on the market is astounding. PopChartLab_Cocktails_Zoom.jpg (3500×5074)
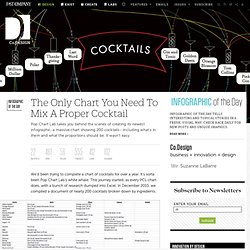
The Rise of the Social Food Truck [INFOGRAPHIC] If the average person was told five years ago that she could nab a delicious and buttery lobster roll from a truck without getting food poisoning, she may have scoffed.
![The Rise of the Social Food Truck [INFOGRAPHIC]](http://cdn.pearltrees.com/s/pic/th/rise-social-truck-infographic-14189072)
Nowadays, chefs across the world are delivering some of the most scrumptious, affordable and delightfully fun food straight to the sidewalks — and social streams. Although food trucks existed well before the early 2000s, many sources pinpoint 2008 as the unofficial onset of the food truck phenomenon. 3xSgR.jpg (JPEG Image, 476x9300 pixels) - Scaled (6.
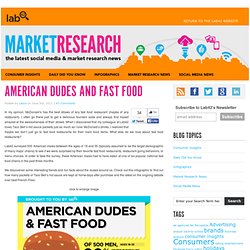
Cheeseburger, cheeseburger. What a Global Food Crisis Looks Like [INFOGRAPHIC] Oxfam is putting the world food crisis right under your mouse.
![What a Global Food Crisis Looks Like [INFOGRAPHIC]](http://cdn.pearltrees.com/s/pic/th/global-crisis-infographic-14139387)
The organization has just released an interactive map showing how countries the world over are being hurt by high and volatile food prices. The Food Price Pressure Points Map is more than just a global snap shot of the food crisis. Corn Eating Personality Test. Comment faire sa bière - infographie. Choosemyplate.gov. Drunk Driving by the Numbers. American Dudes and Fast Food. In my opinion, McDonald’s has the best straws of any fast food restaurant (maybe of any restaurant).
The Eating Habits of Conservatives Versus Liberals [INFOGRAPHIC] Did you know a political conservative is more likely to prefer McDonald's french fries than his liberal counterpart?
![The Eating Habits of Conservatives Versus Liberals [INFOGRAPHIC]](http://cdn.pearltrees.com/s/pic/th/conservatives-infographic-51158882)
Les Francais et... Le vin. L’univers du vin fascine et passionne toujours autant, y compris chez les technophiles et les geeks.
Et le mariage avec internet semble assez réussi, si l’on en juge par le nombre de sites consacrés au divin breuvage, qu’il s’agisse de sites marchands, de blogs ou des deux. L’univers du vin fascine et passionne toujours autant, y compris chez les technophiles et les geeks. Et le mariage avec internet semble assez réussi, si l’on en juge par le nombre de sites consacrés au divin breuvage, qu’il s’agisse de sites marchands, de blogs ou des deux. D’ailleurs, j’ai été surpris de voir le nombre de réactions et de compléments d’information suite à cet article : Le business du vin sur internet en France, publié par Rémy Bigot fin janvier dernier dans ces colonnes.
Pour en savoir plus, voici l’étude au format Scribd, et dessous, la superbe infographie signée du camarade Anthony Legrand qui synthétise les grandes tendances. 10 Fascinating Food Facts.