
Kaggle: Go from Big Data to Big Analytics. Why D3.js is So Great for Data Visualization. When D3 came out in 2011, it became clear pretty quickly that it was going to be a powerful tool for creating data visualizations. But it’s certainly not the first — or only — tool. Why did it succeed when so many other libraries have failed? First of all, it works on the web. Data visualizations are only good if people see them, and there’s no better place to see them than on the internet, in your browser. Protovis was the first library to make any real headway in this direction, despite other libraries and services that tried.
Another reason it has worked so well is because of its flexibility. All of these features have been timed perfectly to coincide with the rise of new browsers and a push towards documents created using open standards rather than relatively walled-in plugins. But snazzy new technologies that work seamlessly aren’t the only reason that D3 has become successful. So how about D3′s disadvantages? D3.js - Data-Driven Documents. Automatic Insight Discovery. Intuitive Data Analysis. The most influential data scientists on Twitter.
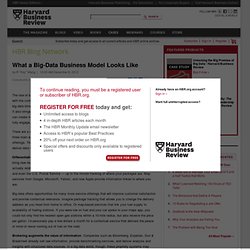
Twitter is emerging as an important medium for determining influence in many fields. Social ranking sites like Klout and Traackr include Twitter as a heavily-weighted component of their ranking algorithms, for example. Twitter isn't representative of the members of any field, but in areas where the members primarily engage online, it can be a useful proxy. SocialFlow's Gilad Lotan has used an analysis of social networks on Twitter to rank influences in such fields, including the communities of python users and data scientists.
Here's the network chart for data scientists: Each circle represents a data scientists on Twitter (anyone with Data Science, Data Scientist, Machine Learning, Data Strategy or the like in their bio). The colors represent connected clusters within the social graph, detected autonomously. Purple seems to be a mix of east coast and academics, while the dark blue is the west coast data drinking crew. What a Big-Data Business Model Looks Like - R “Ray” Wang. By R “Ray” Wang | 10:00 AM December 6, 2012 The rise of big data is an exciting — if in some cases scary — development for business.
Together with the complementary technology forces of social, mobile, the cloud, and unified communications, big data brings countless new opportunities for learning about customers and their wants and needs. It also brings the potential for disruption, and realignment. Organizations that truly embrace big data can create new opportunities for strategic differentiation in this era of engagement. Those that don’t fully engage, or that misunderstand the opportunities, can lose out. There are a number of new business models emerging in the big data world.
Differentiation creates new experiences. Big data offers opportunities for many more service offerings that will improve customer satisfaction and provide contextual relevance. Find. Compare. Decide. The Principles of VBD Revisited. Want to Dominate your League?
Then Dominate your Draft. This article will show you how to do this with the draft system that serious Fantasy Owners across the country use. It's called Value Based Drafting or VBD. Why listen to us about it? Because we are the guys that started it. Today, it's the hot ticket among hardcore owners for one simple reason: It works. The system revolves around making detailed statistical projections for every draftable player. More on that later. The Problem: Here's the trouble with valuing players. When it's your pick in the draft, it's not tough to say Edgerrin James has a higher value than Tatum Bell.
Solid quarterbacks in the Trent Green / Marc Bulger / Matt Hasselbeck range. Integrate Your Apps. Python Data Analysis Library — pandas: Python Data Analysis Library. Scientific Computing Tools For Python — Numpy. A free/open-source library for quantitative finance. DataNitro.
Cage Match. Greg Jackson, the single most successful trainer in the multi-billion-dollar sport of professional mixed martial arts fighting, works out of a musty old gym in Albuquerque, New Mexico, not far from the base of the Sandia Mountains. On a recent morning, the 38-year-old Jackson, who has the cauliflowered ears and bulbous nose of a career fighter, watched two of his students square off inside the chain-link walls of a blood-splattered ring called the Octagon. One of them was Jon Jones, the light heavyweight champion of the Ultimate Fighting Championship (UFC), the premier MMA league. In four weeks, Jones would be defending his title against Rashad Evans, an expert fighter and his former training partner. To prepare him, Jackson had set up a sparring session with Shawn "The Savage" Jordan, a heavyset fighter from Baton Rouge.
Jones and Jordan met in the middle of the ring. "Look for that space, Jones! " To Jackson, it was a logical sequence, one with only one possible effective response.