
How to use Google Experiments on WordPress, In 5 Easy Steps! Blog Don’t be afraid of A/B testing — testing changes to your WordPress website is easy once you know how to use Google Content Experiments!

Content Experiments is a free feature available to websites using Google Analytics, yet even the most savvy of web developers and designers shy away from trying their own experiments. There are three reasons our clients and colleagues have for not to using A/B tests when contemplating changes to your website: Your website is perfect and couldn’t be any better.
That, or you don’t want to be shown to have been wrong about the design, copy, or offer of your current page. How Accurate are Alexa, Compete, DoubleClick and Google Trends? Back in January, SEOmoz did a test of free statistics services like Alexa, Compete, DoubleClick, and Google Trends. Their conclusion was that the visitor data provided by these services did not match their own analytics. Does that mean all of the data provided by these sites are rubbish? Not necessarily. We have relied on these tools for competitor research for ages, so we thought we would go beyond just the visitor data and look at other key pieces of information to see if they match up with Google Analytics data. Comment superviser vos liens sortants sur un site ou un blog. Il ne s’agit pas d’un scoop, mais d’une petite technique que j’utilise pour surveiller certains liens sortants sur mon blog.
Qu’est-ce qu’un lien sortant? C’est un lien qui se trouve sur votre site ou blog qui pointe vers un autre site. Typiquement quand je parle d’un service et que je mets l’url de ce service, c’est un lien sortant. Ce lien sortant sera un lien entrant pour le site en question. AB Tasty un outil d’A/B testing à la portée de tous. L’A/B testing est une pratique qui permet aux entreprises possédant un site internet de tester et d’optimiser leurs pages en fonction du comportement de leurs visiteurs.
Bien souvent lorsque vous désirez améliorer vos taux de conversion, pour l’inscription à une newsletter ou à un achat par exemples, vous réfléchissez à l’organisation de vos pages, à la taille des titres, la couleur des boutons etc. Tous ces critères peuvent impacter de façon non négligeable vos taux de conversion. Track Your Website Visitors and Their Behaviors in Real-time. This post is part of Mashable’s Spark of Genius series, which highlights a unique feature of startups.
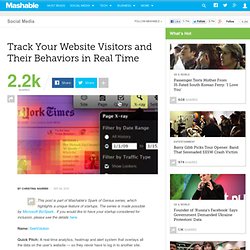
The series is made possible by Microsoft BizSpark.. If you would like to have your startup considered for inclusion, please see the details here. Name: SeeVolution Quick Pitch: A real-time analytics, heatmap and alert system that overlays all the data on the user's website — so they never have to log in to another site. Genius Idea: SeeVolution makes it easy to visualize how visitors are using and interacting with your website. SeeVolution has just entered beta and the service is free for up to five different domains. SeeVolution also has a tracking code for conversion or landing pages, so if there is a page you want to track specifically, you can use that code to get conversion statistics. After you insert the JavaScript, a small "_" hyperlink will appear on the bottom left of your home page.
We like the interface of SeeVolution and appreciate that it is easy to set up. YOUmoz - Google Analytics + Heat Map Analytics + Good Designer = Sexy Conversions. Hey everyone!
After attending the fantastic SEOmoz Conference this past week I stopped into their headquarters for a tour and while perusing their amazing facilities, I stopped and started talking to Joanna, their "Analytics Goddess", about using heat map analytics. If you are unfamiliar with Heat Map analytics, please check out CrazyEgg, I'll be talking about them in this post. A Guide to Google Analytics and Useful Tools - Smashing Magazine. Advertisement Google Analytics is undoubtedly the most widely used web analytics application.
Emerged from and based upon the analytics-package developed by Urchin Software Corporation (which was bought by Google in April 2005), the tool has become publicly available for free under the new flagship of Google Analytics. In May 2007 the application was heavily edited, developed and released; the design was simplified and more advanced featured were added. Over years Google Analytics managed to gain on popularity because of its simplicity and many advanced features for curious site owners and professional marketers. You probably use Google Analytics on a regular basis, for basic stats tracking the performance of your site. Did you know that Google Analytics can generate up to 85 different reports that will help you analyze all possible data about your website traffic.
This post is not a be-all-and-end-all look at GA, but a rough guide to its many under-used features and reports. Clicky – Statistiques de sites web en temps réel - Le blog de l'agence C2Binteractive. How to Measure Page Load Time With Google Analytics. Bounce rate is often regarded as the most frustrating marketing metric.
Why? One reason is because it’s so definitive. But another is that bounce rate is increasingly difficult to improve because of the limited period of time there is to make a first impression. Bounce rate measures the number of visitors that never progress beyond the first page of your site. Essentially, it’s the visitors who didn’t give you much of a chance to begin with. More than just a nuisance, bounce rate is an unfortunately accurate reflection of a visitor’s perception of quality.
So what can you do in that short time between click and bounce to convince a visitor otherwise? 1. For a website that takes more than three seconds to load, 40% of visitors will abandon the site and 80% of those visitors won’t return. Introducing In-Page Analytics: Visual context for your Analytics data. When looking at Google Analytics reports, sometimes it’s difficult to visualize how visitors navigate on a given website page.
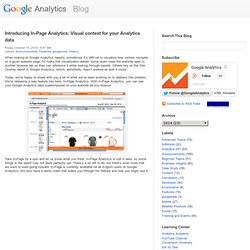
To make this visualization easier, some users keep the website open in another browser tab so they can reference it while looking through reports. Others rely on the Site Overlay report in Google Analytics, which, admittedly, hasn’t worked as well it could.