
Home - Business Intelligence & Advanced Analytics. MOA - Massive Online Analysis. MOA Massive Online Analysis. Building The Analytic Enterprise. Microstrategy Review - MicroStrategy vs. Tableau IT Central Station. After a recent presentation, several attendees asked me about the applications of Visual Insights and Tableau.
Many companies are investing in both tools and are trying to figure out the right tool for specific applications. Tableau has found its sweet-spot as an agile discovery tool that analysts use to create and share insights. It is also the tool of choice for rapid prototyping of dashboards. Tableau is very flexible with its data import. Tableau's data blending capability is very intuitive.
Please complete a very short registration process to gain access to the full post: Register and get these benefits:Full access to 2,500+ in-depth reviewsUpdates on the hottest industry topicsFree report: User Reviews of Business Intelligence Tools. 24 Data Science Resources to Keep Your Finger on the Pulse. There are lots of resources out there to learn about, or to build upon what you already know about, data science.
But where do you start? What are some of the best or most authoritative sources? Here are some websites, books, and other resources that we think are outstanding. If you want to see the latest trends and read analyses of what’s happening in the data science field…
Predictive Analytics 101 Business Analytics 3. Insight, not hindsight is the essence of predictive analytics. How organizations instrument, capture, create and use data is fundamentally changing the dynamics of work, life and leisure. I strongly believe that we are on the cusp of a multi-year analytics revolution that will transform everything. Using analytics to compete and innovate is a multi-dimensional issue. It ranges from simple (reporting) to complex (prediction). Reporting on what is happening in your business right now is the first step to making smart business decisions. By automatically delivering relevant insights to end-users, managers and even applications, predictive decision solutions aims to reduces the need of business users to understand the ‘how’ and focus on the ‘why.’ Measureful Blog - Your data tells a story. It's time to start listening. Matt Davis — A Member of The Gartner Blog Network.
Matthew Davis Research Director 3 years at Gartner 12 years IT Industry Matt Davis is a Supply Chain Research Director and lead analyst for Supply Chain Strategy. Read Full Bio On-Demand Supply Chain Webinars by Matt Davis | August 21, 2013 | 1 Comment ”Would anyone actually sit for 45 minutes or so to listen to a webinar?” A common link to communication issues in both broader supply chain strategy and in segmentation initiatives is that people use the same term to mean different things AND they have different ideas on the scope of the work.
Panopticon's Call Center Dashboard. No votes for this yet A monitoring and analytics Dashboard designed for use in a Call Center provides managers with a visual overview and details on the performance of each telemarketer and each group.
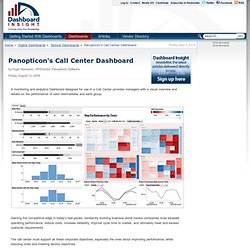
Gaining the competitive edge in today’s fast-paced, constantly evolving business world means companies must escalate operating performance, reduce costs, increase reliability, improve cycle time to market, and ultimately meet and exceed customer requirements. The call center must support all these corporate objectives, especially the ones about improving performance, while reducing costs and meeting service objectives. SAP Business Analytics Solutions Placemat » SAP Bloggers Corner. I have heard about confusion in the market about SAP’s business analytics offerings.
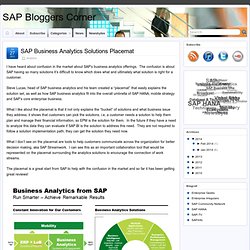
The confusion is about SAP having so many solutions it’s difficult to know which does what and ultimately what solution is right for a customer. Steve Lucas, head of SAP business analytics and his team created a “placemat” that easily explains the solution set, as well as how SAP business analytics fit into the overall umbrella of SAP HANA, mobile strategy and SAP’s core enterprise business.
What I like about the placemat is that it not only explains the “bucket” of solutions and what business issue they address; it shows that customers can pick the solutions. i.e, a customer needs a solution to help them plan and manage their financial information, so EPM is the solution for them. In the future if they have a need to analyze this data they can evaluate if SAP BI is the solution to address this need.
They are not required to follow a solution implementation path; they can get the solution they need now. Top 5 IT Certifications of 2014 - Infographic. To embed this infographic on your site or within a blog post (Copy and paste this code): <a href=" target="_blank"><img src=" border="0" alt="Top 5 IT Certifications of 2014 - Infographic" /></a><p style="text-align:center;"><a href=" to you by Western Governors University</a></p> Did you find this helpful?

Check out Top IT Certifications of 2014 Western Governors University is a nonprofit, accredited, online university. WGU offers bachelor's and master's online degree programs in IT. Thoughts from a Business Analytics Vendor in Vancouver. BI Examples InetSoft Technology Information and Resources. Business Intelligence & Business Analytics, Analyze and Report, Escalating One Point Solutions. Business Analytics – previously commonly known as BI – allows companies to analyze and report upon data, using centralized graphical formats and dashboards, providing intuitive dashboard-driven analytics for executives, finance, marketing, sales, and general end users.
It’s also key to employ integration into centralized repositories (data marts/warehouses) and avoid duplicated and often inaccurate spreadsheets that require a great deal of IT intervention and manual process. Products include: Core Elements. Customer Analytics Blog Series Part 3 – Analytics Provides Input to Strategic Operations Data Blending and Advanced Analytics Alteryx. In my previous blog in the Customer Analytics series, I reviewed the list of the most popular data sources that organizations are purchasing or creating about their customers.
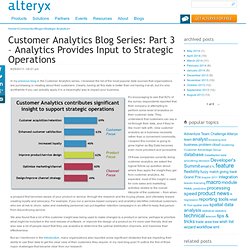
Clearly, having all this data is better than not having it at all, but it’s only worthwhile if you can actually apply it in a meaningful way to impact your business. It’s encouraging to see that 82% of the survey respondents reported that their company is attempting to perform some level of analytics on their customer data. They understand that customers can say a lot through their data, and if they’re like most I talk with, view customer analytics as a business necessity rather than a convenient commodity. I suspect this number is going to grow higher as Big Data becomes even more prevalent and accessible. Of those companies currently doing customer analytics, we asked the logical follow-up question about where they apply the insight they get from customer analytics. Bob Laurent Director of Industry Marketing. Customer Retail Analytics (CRA) Nanuka Indonesia - Next Generation Digital Solutions.
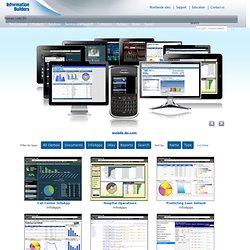
Demos on Business Intelligence, Analytics, Dashboards, Data Quality and More Information Builders. Primary Links EN Search Interactive eStatements Connect with Us Social Media Focal Point Blog Worldwide offices Key Topics Self-Service Analytics Dashboards InfoApps Mobile BI Predictive Analytics Visual Discovery Data Integration Master Data Management Data Quality Popular Links Careers Product list Customer successes Technical Support Education Company Overview Contact us.
Emerald Insight Journal of Business Strategy Integrating business analytics into strategic planning for better performance. Financial Analytics CFO Dashboard Financial Reporting CFO Performance Dashboard. In today's challenging economic climate, finance within the enterprise has come under unprecedented scrutiny.
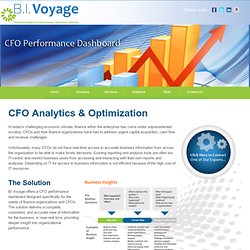
CFOs and their finance organizations have had to address urgent capital acquisition, cash flow and revenue challenges. Unfortunately, many CFOs do not have real-time access to accurate business information from across the organization to be able to make timely decisions. Www.sas.com-knowledge-exchange-business-analytics-files-2011-11-elements_figure2_sm.gif. Information Technology & Operations Management Concentration Business Analytics @ SMU Cox. In today’s digital economy, massive amounts of data are generated by all types of organizations, institutions, and consumers.
Companies have to respond to this information deluge faster and better than ever with better decisions, plans and strategies. Business Analytics at IBM. Perhaps more than any other company, IBM helped create the model for the modern corporation—by its technology, its broad range of clients, and particularly by its own example. Now, a decade into the 21st century, the model for the modern organization is being remodeled once again. For a business to know what has occurred, it first needs trusted information, presented in a clear way. Deedle: Exploratory data library for .NET.
Deedle is an easy to use library for data and time series manipulation and for scientific programming. It supports working with structured data frames, ordered and unordered data, as well as time series. Deedle is designed to work well for exploratory programming using F# and C# interactive console, but can be also used in efficient compiled .NET code. The library implements a wide range of operations for data manipulation including advanced indexing and slicing, joining and aligning data, handling of missing values, grouping and aggregation, statistics and more.
Titanic survivor analysis in 20 lines. Analytics Built for IoT. Refine - tool for working with messy data. A Year Makes a Big Difference for Big Data Analytics. Users of big data analytics are finally going public. At the Hadoop Summit last June, many vendors were still speaking of a large retailer or a big bank as users but could not publically disclose their partnerships.
Companies experimenting with big data analytics felt that their proof of concept was so innovative that once it moved into production, it would yield a competitive advantage to the early mover. Now many companies are speaking openly about what they have been up to in their business laboratories. I look forward to attending the 2013 Hadoop Summit in San Jose to see how much things have changed in just a single year for Hadoop centered big data analytics. Datameer Provides Business Visualization and Discovery for Hadoop. The Personas that Matter the Most in Business Analytics.
As a new generation of business professionals embraces a new generation of technology, the line between people and their tools begins to blur. This shift comes as organizations become flatter and leaner and roles, The Four Pillars of Big Data Analytics. The Brave New World of Business Intelligence. Tableau Continues its Visual Analytics Revolution. In his keynote speech at the sixth annual Tableau Customer Conference, company co-founder and CEO Christian Chabot borrowed from Steve Jobs’ famous quote that the computer “is the equivalent of a bicycle for our minds,” to suggest that his company software is such a new bicycle.
He went on to build an argument about the nature of invention and Tableau’s place in it. The people who make great discoveries, Chabot said, start with both intuition and logic. This approach allows them to look at ideas and information from different perspectives and to see things that others don’t see. In a similar vein, he went on, Tableau allows us to look at things differently, understand patterns and generate new ideas that might not arise using traditional tools. Business Analytics in 2014 Trends and Possibilities. Four Types of Discovery Technology For Using Big Data Intelligently. Big Data and Analytics Helps Business Transform and Gain Competitive Advantage. In our benchmark research on business technology innovation, organizations ranked analytics the number-one priority (for 39%) among six technology trends.
Big data, perhaps because it is a more technical concept, ranked fifth, with 11 percent of organizations calling it a top innovation priority. Paxata Give Analysts Valuable Time Back for Analytics. Like Big Data, Operational Intelligence is Evolving to Deliver Right Time Value. Ventana Research has been researching and advocating operational intelligence for the past 10 years, but not always with that name.
IBM Brings New Innovation in Analytics for Business Insights. Tonycosentino.ventanaresearch.com- Integrating Business Intelligence into the Enterprise (Part II) by Mike Ferguson - August 2002 Free Article - Technology Transfer. Math.NET Numerics - Home. DnAnalytics - Home. Disappointing the Digital Enterprise with Bad Business Data - Reality Check. What Is Business Intelligence 3.0? Commercial Data Visualization Apps - Steve "Guggs" Guggenheimer's blog. Learning and Knowledge Analytics - page 2.
Visual Data Discovery Solutions. Big Data. Real-Time Analytics Add-On with Terracotta BigMemory. Dremel: Interactive Analysis of Web-Scale Datasets. Social Media and Big Data Analytics Platform (For the Masses) - Decooda. Solutions for Lustre* software. Atigeo. INFORMS' Analytics Definition - OR-X. BI Search: The Time Has Come - Blog: Wayne Eckerson. Industry Data Models. Predictive Analytics Reporting (PAR) Framework. Analytics for Big Data – Venturing with the Twitter Use Case. Pragmatic Programming Techniques: BIG Data Anal... Big Data Business Model Maturity Chart.
Information. Products.