
Untitled. Data Science and Data Analytics are two most trending terminologies of today’s time.
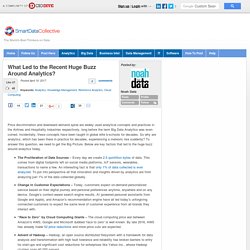
Presently, data is more than oil to the industries. Data is collected into raw form and processed according to the requirement of a company and then this data is utilized for the decision making purpose. This process helps the businesses to grow & expand their operations in the market. But, the main question arises – What is the process called? SAS COO And CTO Oliver Schabenberger Reflects On Staying Power Of Analytics. The 4 Types of Data Analytics. We've covered a few fundamentals and pitfalls of data analytics in our past blog posts.
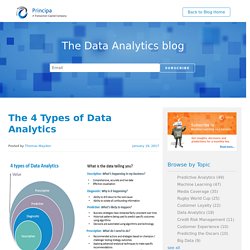
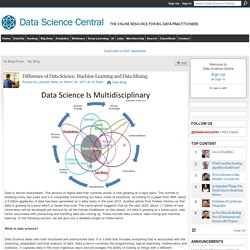
In this blog post, we focus on the four types of data analytics we encounter in data science: Descriptive, Diagnostic, Predictive and Prescriptive. Note: This blog post was published on the KDNuggets blog - Data Analytics and Machine Learning blog - in July 2017 and received the most reads and shares by their readers that month. When I talk to young analysts entering our world of data science, I often ask them what they think is data scientist's most important skill.
Their answers have been quite varied. 5 Actual Big Data Uses That Make Our Life Better. The Big Data Revolution (with the help of Machine Learning , Deep Learning and Artificial Intelligence) can transform our world in a « Big Brother Nightmare »… It could be… but, The Big Data can at the opposite improve our lives for a better tomorrow.
Choosing the humanist way will be only a human choice… So, let’s check these 5 actual cases where the Big Data ecosystem improve humanity lives for real. #1 -Anticipating Meteorological Crises By combining marine observation sensors, ocean’s waves & currents + other data with analytical tools running with Machine Learning, researchers can develop predictions of tsunamis and other natural disasters, and so saving the lives of thousands of people living in coastal areas. #2 – More Saved Premature Babies. Firing on All Cylinders: The 2017 Big Data Landscape – Matt Turck. It feels good to be a data geek in 2017.
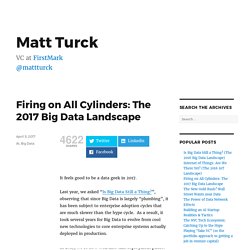
Last year, we asked “Is Big Data Still a Thing?” , observing that since Big Data is largely “plumbing”, it has been subject to enterprise adoption cycles that are much slower than the hype cycle. As a result, it took several years for Big Data to evolve from cool new technologies to core enterprise systems actually deployed in production. Firing on All Cylinders: The 2017 Big Data Landscape – Matt Turck. What Is Big Data Analytics And Why do I Need It For My Business? - Maruti Techlabs. Big data is primarily defined by the volume of a data set.
Big data sets are generally huge – measuring tens of terabytes – and sometimes crossing the threshold of petabytes. The term big data was preceded by very large databases (VLDBs) which were managed using database management systems (DBMS). Today, big data falls under three categories of data sets – structured, unstructured and semi-structured. Structured data sets comprise of data which can be used in its original form to derive results.
Examples include relational data such as employee salary records. Unstructured data sets, on the other hand, are without proper formatting and alignment. Difference of Data Science, Machine Learning and Data Mining. Data is almost everywhere.
The amount of digital data that currently exists is now growing at a rapid pace. The number is doubling every two years and it is completely transforming our basic mode of existence. According to a paper from IBM, about 2.5 billion gigabytes of data had been generated on a daily basis in the year 2012. Another article from Forbes informs us that data is growing at a pace which is faster than ever. The same article suggests that by the year 2020, about 1.7 billion of new information will be developed per second for all the human inhabitants on this planet. The Data within Big Data and the myth around Unstructured Data - Cognitive Today :The New World of Cognition and Advanced Analytics. What Led to the Recent Huge Buzz Around Analytics?
Price discrimination and downward demand spiral are widely used analytical concepts and practices in the Airlines and Hospitality industries respectively, long before the term Big Data Analytics was even coined.
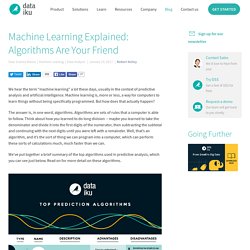
Incidentally, these concepts have been taught in global elite b-schools for decades. So why are analytics, which has been there in practice for decades, experiencing a meteoric rise suddenly? To answer this question, we need to get the Big Picture. Below are key factors that led to the huge buzz around analytics today. The Proliferation of Data Sources – Every day we create 2.5 quintillion bytes of data. Open source distributed platforms coupled with massively discounted storage & compute costs (cloud) have given Start-ups equal footing with Enterprises in developing and launching innovative products leveraging Big Data and Analytics (which was possible only by firms with deep pockets until few years ago). Machine Learning Explained: Algorithms Are Your Friend. We hear the term “machine learning” a lot these days, usually in the context of predictive analysis and artificial intelligence.
Machine learning is, more or less, a way for computers to learn things without being specifically programmed. But how does that actually happen? The answer is, in one word, algorithms. Algorithms are sets of rules that a computer is able to follow. Big Data Analytics: 11 Case Histories and Success Stories. Welcome. The What and Where of Big Data: A Data Definition Framework. Figuring Out How IT, Analytics, and Operations Should Work Together. A new set of relationships is being formed within companies around how people working in data, analytics, IT, and operations teams work together.

Is there a “right” way to structure these relationships? Data and analytics represent a blurring of the traditional lines of demarcation between the scope of IT and the responsibilities of operating divisions. Consider the core mission of the modern IT department: Taking in all the technology “mess” (often from several different divisions), developing the necessary competencies, and delivering savings and efficiency to the company.
Many IT organizations, having achieved this original mission, now are turning to the next thing, which is innovation. Analytics: Turning a Flood of Data into Valuable Information. The benefits that come from data analytics are many — it's helped reduce inmate populations, improve reliability of emergency medical services and reduce traffic fatalities, to name just a few.
Though some government agencies are slow to embrace it due to limited capital or sheer intimidation in the face of disparate systems and fragmented technologies, others have taken hold of the proverbial horns and started the process of improving their daily operations by way of the data. And during the California Technology Forum held Aug. 11 in Sacramento, state and local officials delved into the insights gained from the exponential increase of data — and where teams need to focus their energy to turn this flood of data into valuable information. “From that, I understood that big data wasn’t just the amount of data we were talking about," he said. "There are many other things we need to consider.” Graham called the process employed in Los Angeles the collaborative leadership model. DataViz. 50 external machine learning / data science resources and articles. Data Science Central 50 external machine learning / data science resources and articles by Vincent Granville Sep 24, 2015.
Data Visualisation: What's the big deal? The concept of using pictures to understand complex information — especially data — has been around for a very long time, centuries in fact. One of the most cited examples of statistical graphics is Napoleon’s invasion of Russia mapped by Charles Minard. The maps showed the size of the army and the path of Napoleon’s retreat from Moscow.
It also included detailed information like temperature and time scales, providing the audience with an in-depth understanding of the event. However, as with most things, it’s technology that has truly allowed data visualisation to take the stage and get noticed. IT Operations Analytics. In the fields of information technology and systems management, IT Operations Analytics (ITOA) is an approach or method applied to application software designed to retrieve, analyze and report data for IT operations. ITOA has been described as applying big data analytics to large datasets where IT operations can extract unique business insights.[1][2] In its Hype Cycle Report, Gartner rated the business impact of ITOA as being ‘high’, meaning that its use will see businesses enjoy significantly increased revenue or cost saving opportunities.[3] By 2017, Gartner predicts that 15% of enterprises will use IT operations analytics technologies to deliver intelligence for both business execution and IT operations.[2] Definition[edit] History[edit]
Finding Data on the Internet. Skip to Content A Community Site for R – Sponsored by Revolution Analytics Home » How to » Finding Data on the Internet Finding Data on the Internet. Where can I find large datasets open to the public? Publicly Available Big Data Sets. Trends in Big Data Vs Hadoop Vs Business Intelligence. Use Cases - MAANA. Forbes Welcome. Big Data: Top 100 Influencers and Brands. Big Data A to ZZ – A Glossary of my Favorite Data Science Things. What Really Is Big Data? How is Big Data Used in Practice? 10 Use Cases Everyone Must Read.
What do you think of when you think of "big data"? For many, it's a nebulous term that invokes images of huge server farms humming away. Or perhaps you think of receiving some kind of personalized advertisement from a retailer. But big data is so much deeper and broader than that. I believe there are 10 major areas in which big data is currently being used to excellent advantage in practice - but within those arenas, data can be put to almost any purpose. 1. This is one of the biggest and most publicized areas of big data use today. You might remember the example of U.S. retailer Target, who is now able to very accurately predict when one of their customers will expect a baby. Ski resorts are even using data to understand and target their patrons.
Imagine being an avid skier and receiving customized invitations from your favorite resort when there's fresh powder on your favorite run, or text alerts letting you know when the lift lines are shortest. 2. 3. 4. 5. 6. 7. 8. 9. 10. Getting big impact from big data. What’s the Big Data? 12 Definitions. Last week I got an email from UC Berkeley’s Master of Information and Data Science program, asking me to respond to a survey of data science thought leaders, asking the question “What is big data”? I was especially delighted to be regarded as a “thought leader” by Berkeley’s School of Information, whose previous dean, Hal Varian (now chief economist at Google, answered my challenge fourteen years ago and produced the first study to estimate the amount of new information created in the world annually, a study I consider to be a major milestone in the evolution of our understanding of big data.
The Berkeley researchers estimated that the world had produced about 1.5 billion gigabytes of information in 1999 and in a 2003 replication of the study found out that amount to have doubled in 3 years. The traditional database of authoritative definitions is, of course, the Oxford English Dictionary (OED). But this is 2014 and maybe the first place to look for definitions should be Wikipedia. When Is Big Data Analytics A Waste Of Time? Your guide to international Big Data universities: IBM edition. The Big Data market is expected to grow to $28.5 billion by the end of 2014 and to top $50 billion by 2017, according to a recent Wikibon report. The 4 Layers of Big Data Everyone Must Know. Kill the Buzzwords: Finding the Real Meaning of Popular BI Terms. Big Data: The 5 Vs Everyone Must Know.
What’s Hadoop? Analytics.