
Magic Quadrant for Business Intelligence and Analytics Platforms. Analyst(s): Rita L.
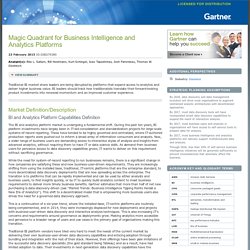
Sallam, Bill Hostmann, Kurt Schlegel, Joao Tapadinhas, Josh Parenteau, Thomas W. Oestreich Figure 1. Magic Quadrant for Business Intelligence and Analytics Platforms Source: Gartner (February 2015) Overview of Magic Quadrant Positioning The vendors' positions in this Magic Quadrant reflect the current market transition.
The year 2014 has been another year of challenging execution for the market share leaders in the BI and analytics market, juxtaposed against strong execution by the data discovery vendors that are satisfying customers, meeting their buying requirements and delivering greater business value. The current BI and analytics market situation looks similar to the mainframe/workstation market in the late 1980s, which had a complete shift in requirements and buyers. While data discovery platforms predominantly complement IT-centric systems-of-record deployments, they are being used for much of the new analytics project investments.
Talks - Live Talks, Webcasts and Seminars – Informatica. Statista - The Statistics Portal for Market Data, Market Research and Market Studies. Four Ways to Slice Obama’s 2013 Budget Proposal - Interactive Feature. Untitled. Everyone's got a home, and ours is Iowa.
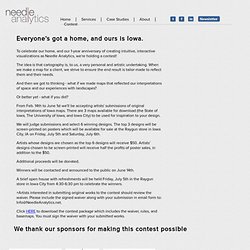
To celebrate our home, and our 1-year anniversary of creating intuitive, interactive visualizations as Needle Analytics, we're holding a contest! The idea is that cartography is, to us, a very personal and artistic undertaking. When we make a map for a client, we strive to ensure the end result is tailor-made to reflect them and their needs. And then we got to thinking - what if we made maps that reflected our interpretations of space and our experiences with landscapes? Or better yet - what if you did? From Feb. 14th to June 1st we'll be accepting artists' submissions of original interpretations of Iowa maps. We will judge submissions and select 6 winning designs. Artists whose designs are chosen as the top 6 designs will receive $50. Additional proceeds will be donated. Winners will be contacted and announced to the public on June 14th. +Artists interested in submitting original works to the contest should review the waiver.
BI Leadership Forum. BI Leadership Forum Research Represented Companies Advance Auto Parts Alfa Insurance Arizona State University Blue Cross/Blue Shield Kansas City BMW of NA BNP Parabis Fortis Bridgepoint Education Harley Davidson Health Care Service Corp.
Illinois State University Linkshare Navistar NetApp Noumenal, Inc. RBC Wealth Management. Unified Information Access. Redshift. Amazon Redshift is a fast, fully managed, petabyte-scale data warehouse service that makes it simple and cost-effective to efficiently analyze all your data using your existing business intelligence tools.
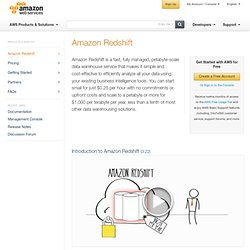
You can start small for just $0.25 per hour with no commitments or upfront costs and scale to a petabyte or more for $1,000 per terabyte per year, less than a tenth of most other data warehousing solutions. Introduction to Amazon Redshift (3:22) Amazon Redshift delivers fast query performance by using columnar storage technology to improve I/O efficiency and parallelizing queries across multiple nodes. Redshift uses standard PostgreSQL JDBC and ODBC drivers, allowing you to use a wide range of familiar SQL clients. Data load speed scales linearly with cluster size, with integrations to Amazon S3, Amazon DynamoDB, Amazon Elastic MapReduce, Amazon Kinesis or any SSH-enabled host . Security is built-in. You pay only for the resources you provision.
High Performance, Cost-Effective Enterprise Business Analytics - Overview. Data is coming into businesses faster and more furiously than ever.
Getting it into the hands of all users, including the decision-makers at the point of customer interaction, is crucial to owning a competitive advantage. Business Analytics has moved beyond “initiative”; today it’s a business imperative. This demands a new approach that extends beyond analytic reports and dashboards to embedding more real-time data into the operational fabric of the enterprise. But this requires tight integration between transactional, data warehousing and business analytics solutions across the business, departments, and systems, for a modern information hub that can support real-time, enterprise-wide decisions.
This seminar will show you how IBM zEnterprise and related analytics tools address this challenge—without requiring a redesign of your infrastructure.