
A Completely Different Kind Of Landing Page Optimization. What exactly is landing page optimization?
For most search marketers, optimizing landing pages means A/B testing and multivariate testing (MVT). It means using tools such as Google Website Optimizer to experiment with different arrangements of a page – or different variations in the content of a page – to maximize its conversion rate. We may ask questions about many different elements of a page. Which headline works best? Is the offer button better with “complimentary shipping” or “free shipping”? This is landing page optimization as most people know it. But content optimization is not the only way to optimize landing pages. Segment optimization offers a new approach Segment optimization is about determining how many different landing pages are optimal for a given campaign, and determining how each should be different from the other.
For example, say you’re marketing language learning software. Just consider the headline. You could never achieve this using one page for everyone. A Post-Click Marketing Heuristic. Post-click marketing is a big umbrella.
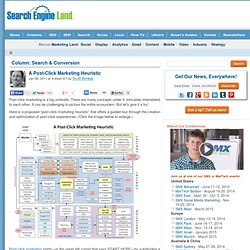
There are many concepts under it, intricately interrelated to each other. It can be challenging to picture the entire ecosystem. But let’s give it a try! Here is a proposed “post-click marketing heuristic” that offers a guided tour through the creation and optimization of post-click experiences. (Click the image below to enlarge.) Post-click marketing starts—in the upper left corner that says START HERE—by subdividing a market into distinct audience segments. Great Post-click Marketing Starts With Context To create effective post-click marketing, you need to start with the context of your audience.
Who are these respondents? You may not be able to answer these definitively, but the better sense you have of who your respondents are, and the context in which they’ve arrived on your landing page — the more effective your post-click marketing will be. 7 Ways Google Analytics Can Help Inform Design Decisions. Paul wrote about ClickTale a couple months back, noting that the heatmaps that ClickTale offers can often provide insight into what content and elements visitors are paying attention vs. what needs improvement.
However, if you don't have time or money to get ClickTale up and running but you do already have Google Analytics installed on your current, there are several reports that you can use to glean information that could help inform future UX and visual design direction. Below you'll find seven reports that you may want to take a peek at before starting your redesign process. Depending on the complexity of your site and GA setup, it could take you anywhere from 1 to 10+ hours to run through each of these reports. Three Tools that Make Analytics Even Better.
GA is great for answering 99% of the questions I have about my website.
Luckily, some other great tools exist that make answering that remaining 1% a lot easier. Here are three of my favorite: 1) ClickTale This tool tops the list because it's spectacular. In GA, you can't easily get a visualization of where visitors are clicking on an individual page. Don't Forget Your Logged Out Users. I find myself saying this quite often these days to entrepreneurs and their product teams.
It's something that I've noticed working with leading social platforms like Etsy, Twitter, Tumblr, and others. Services such as these have a large number of their users accessing the service regularly on a logged out basis. Augmenter ses taux de conversion avec très peu d’efforts. 4 Quick Tips for Getting the Most out of Google Analytics. There are plenty of tools and services out there for measuring useful statistics when doing research on websites.
I’m often surprised to see people choose expensive tools with limited capability over Google Analytics. It’s true that Google Analytics feature set can seem a bit daunting, but if you invest a little time learning about it, Google Analytics can really be a valuable tool for user experience designers. As an added bonus, many sites already have it installed, which means that if you’re walking into a new project, you might already have a plethora of historical data waiting to be analyzed.
In this post, I’m going to share a few easy-to-use features Google Analytics boasts that aren’t always self-evident to newer users of the software. Use the different data views In many of Google Analytic’s reports it’s possible to switch the presentation of data. Switching views is simple. Table view The Table view is typically the standard data view when going over statistics.
Percentage view.