
About Fusion Tables - Fusion Tables Help. Bust your data out of its silo!

Get more from data with Fusion Tables. Fusion Tables is an experimental data visualization web application to gather, visualize, and share data tables. Visualize bigger table data online Filter and summarize across hundreds of thousands of rows. Then try a chart, map, network graph, or custom layout and embed or share it. Two tables are better than one! Merge two or three tables to generate a single visualization that includes both sets of data. Make a map in minutes. Data Explorer” Preview for Excel 101. Importing data from web page In this tutorial, you create a query that imports data from a web page.
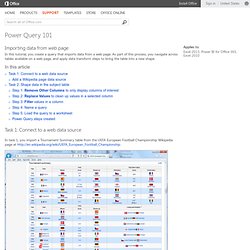
As part of this process, you navigate across tables available on a web page, and apply data transform steps to bring the table into a new shape. In this article Task 1: Connect to a web data source In task 1, you import a Tournament Summary table from the UEFA European Football Championship Wikipedia page at Add a Wikipedia page data source In the POWER QUERY ribbon tab, click From Web.
After establishing a connection to the web page, you see a list of tables available on this Wikipedia page in the Navigator pane. In the Navigator pane, double click the Results[edit] table for the Tournament Summary results, or select the Results[edit] table and click Edit Query. After you open the Query Editor, you can start to shape your query. Top of Page Task 2: Shape data in the subject table Step 1: Remove Other Columns to only display columns of interest Select the Year column.
Jamie's Junk. Live!Samples. Data Validation Sample. Time Series Prediction Webcast. Jamie's Junk. Thanks to some connections at Microsoft I was made aware of some very interesting data that was published on the Windows Azure Data Marketplace by Practice Fusion – deidentified medical records of 5000 patients.
Of course, I had to take a look. What I found was a very compelling and interesting set of data, that was more interesting when looked through the lens of Predixion Insight. Of course, as with any data that you may get from anywhere, there are first some issues in the data itself that need to be “corrected” before used for any analysis. In this post I’ll show you how to get that data, explore a little bit of it, and clean up one particular part. There’s lots more to do, but this is just getting your feet wet.
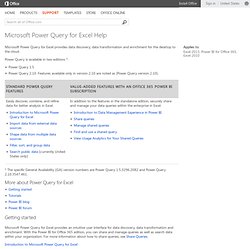
PowerPivot Ribbon Section Inside the PowerPivot window you will need to click the “From Azure Marketplace” button in the Get External Data chunk of the ribbon shown below. Table Import Wizard – Specifying the Data Feed After that, select all the tables and click finish. Data Explorer” Preview for Excel Help. Microsoft Power Query for Excel provides data discovery, data transformation and enrichment for the desktop to the cloud.
Power Query is available in two editions *: Power Query 1.5 Power Query 2.10. Features available only in version 2.10 are noted as [Power Query version 2.10]. * The specific General Availability (GA) version numbers are Power Query 1.5.3296.2082 and Power Query 2.10.3547.461. More about Power Query for Excel Getting started. Import data from external data sources. <div class="cdOLblEmRed cdSearchResultsMargin">Warning: This site requires the use of scripts, which your browser does not currently allow.
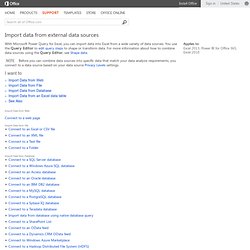
<a href=" how to enable scripts. </a><br/></div> Import data from external data sources With Microsoft Power Query for Excel, you can import data into Excel from a wide variety of data sources. You use the Query Editor to edit query steps to shape or transform data. Note Before you can combine data sources into specific data that match your data analysis requirements, you connect to a data source based on your data source Privacy Levels settings. I want to. Predictive Analytics with Microsoft SQL Server 2012. Predictive Analytics Video Tutorials. September 24, 2013: Live Twitter Event: The Accenture Analytics Journey to ROI At a time when only one in five companies is very satisfied with their analytics investment, we shared our issues to outcomes approach, using data, analytics, insights and actions to achieve high performance.
Panelists from HP, Predixion and Revolution shared their insights on analytics with Brian McCarthy, Managing Director, Innovation for Accenture Analytics. Watch Now September 18, 2013: Hot Technologies of 2013 with James Taylor, Robin Bloor and Predixion Software. In this 1 hour webcast hosted by The Bloor Group, you will hear veteran analysts James Taylor and Robin Bloor as they put forth their visions for how embedded analytics can dramatically alter how modern companies operate. Watch Now September 5, 2013: "The Power of Embedded Predictive Analytics" Host by the PDMA, the ~60mins webcast is presented by James Taylor from Decision Management Solutions and Mark McNally from Predixion Software. Watch Now.