
Annex A - safety-change-and-transition-tools-compendium-annex-a-2010.pdf. Training Industry Magazine - Winter 2014 [46 - 47] The Lewis Model. Title - maximizing_the_effectiveness_of_sales_training.pdf. Situational Leadership® Training & Management Model by CLS. “Is there really any difference between Situational Leadership® and SLII®?”
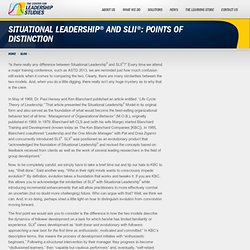
Every time we attend a major training conference, such as ASTD 2013, we are reminded just how much confusion still exists when it comes to comparing the two. Clearly, there are many similarities between the two models. And, when you do a little digging, there really isn’t any huge mystery as to why that is the case. In May of 1969, Dr. Paul Hersey and Ken Blanchard published an article entitled: “Life Cycle Theory of Leadership.” Now, to be completely candid, we simply have to take a brief time out and tip our hats to KBC to say, “Well done.” The first point we would ask you to consider is the difference in how the two models describe the dynamics of follower development on a task for which he/she has limited familiarity or experience. Key points of distinction: We would say, “Absolutely!” So, are there differences between Situational Leadership® and SLII®? Application Challenge References: Roy B. Footnote: 2_-change_readiness_assessment_0426111.pdf.
Handbook of Management Scales. The Handbook of Management Scales is a collection of previously used multi-item scales to measure constructs in empirical management research literature.
Critical Introduction[edit] The Handbook of Management Scales was first edited by A. Wieland in 2010 and has since grown. It contains a collection of measurement scales, which are the basis for empirical research. Unfortunately, management researchers often neglect the importance of good scales. The deletion of scale items (often called “scale purification”) may improve Cronbach's alpha or the statistical performance indicators of a model. Reflective scales often prevail in management research. You are invited to contribute by adding new multi-item metrics (edit this page) to this Scales Handbook. Readiness for Organizational Change - viewcontent.cgi. Abbyy - readiness_for_organizationa.pdf. JanAE-ChangeReadiness.pdf. The Organizational Change Readiness Assessment. By Douglas B.

Reeves In Chapter 2 we considered your personal change experiences. In this chapter we review your experiences with organizational change and then integrate these two sets of experiences to complete your personal Change Readiness Assessment. Remember, the physical act of writing is important, so please complete all of the work in this chapter, including the written responses and the scoring of your change experiences. If you prefer to enter your responses on a computer, you can complete the Change Readiness Assessment for free by using the online service at www.
Consider three organizational changes that you have experienced in the past five years. These descriptions could, of course, make a score of 10 seem out of reach, but that is precisely the point. Please take a few minutes to complete the following paragraphs. Think of several organizational changes in the past five years that have particular relevance for you.
Figure 3.1 Organizational Change Readiness Assessment. How to assess change readiness. Summary and key action points The purpose of a change readiness assessment is to analyse the level of preparedness of the conditions, attitudes and resources, at all levels in a systemIn this context the word 'system' is being used to cover organisations, sectors, networks, national structures, or any other combination of elements that might together be the focus of a capacity development initiative., needed for change to happen successfully.
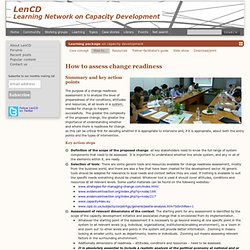
The greater the complexity of the proposed change, the greater the importance of understanding whether and where there is readiness for change as this can be critical first for deciding whether it is appropriate to intervene and, if it is appropriate, about both the entry points and the types of intervention. Key action steps. Innovate. SR. BJ Fogg's Website. Data Visualization, Design and Information Munging // Martin Krzywinski / Genome Sciences Center. Introduction to Circos, Features and Uses // CIRCOS Circular Genome Data Visualization. Introduction to Circos, Features and Uses // CIRCOS Circular Genome Data Visualization.
Share it: Embed an Excel workbook on your blog - Office Web Apps. Speedometer Chart / Gas Gauge Chart. A speedometer graph is comprised of multiple components to give the illusion of one chart.
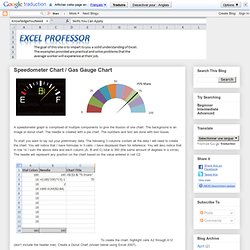
The background is an image or donut chart. The needle is created with a pie chart. The numbers and text are done with text boxes. To start you want to lay out your preliminary data. TimeFlow Analytical TimelineVisual timelines for investigation · FlowingMedia/TimeFlow Wiki. Isee systems - The World Leader in Systems Thinking Software.