
KeyLines - Network Visualization Software. The 14 Best Data Visualization Tools. Nishith Sharma is the co-founder of frrole, a social intelligence startup.
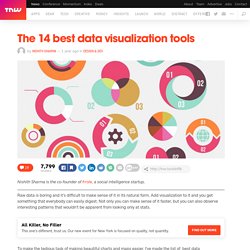
Raw data is boring and it’s difficult to make sense of it in its natural form. Add visualization to it and you get something that everybody can easily digest. Not only you can make sense of it faster, but you can also observe interesting patterns that wouldn’t be apparent from looking only at stats. All Killer, No Filler This one’s different, trust us. To make the tedious task of making beautiful charts and maps easier, I’ve made the list of best data visualization tools available for the job. Let’s get started!
Cytoscape.js. p5.js. Cola.js. Three.js - Javascript 3D library. Sigma js. JointJS. Dagre. JointJS. Product - Linkurious - Understand the connections in your data. Bl.ocks.org - about. Tree diagrams in d3.js. The following post is a portion of the D3 Tips and Tricks book which is free to download.
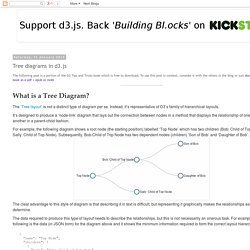
To use this post in context, consider it with the others in the blog or just download the the book as a pdf / epub or mobi . What is a Tree Diagram? The ‘Tree layout’ is not a distinct type of diagram per se. Instead, it’s representative of D3’s family of hierarchical layouts. It’s designed to produce a ‘node-link’ diagram that lays out the connection between nodes in a method that displays the relationship of one node to another in a parent-child fashion. For example, the following diagram shows a root node (the starting position) labelled ‘Top Node’ which has two children (Bob: Child of Top Node and Sally: Child of Top Node). The clear advantage to this style of diagram is that describing it in text is difficult, but representing it graphically makes the relationships easy to determine.
A simple Tree Diagram explained The graphic that we are going to generate will look like this… D3 Company Chart Organization Chart. ArchitectureTree Demo. Ben Podgursky. d3-legend.susielu. /chapter: Copyright / Developing a D3.js Edge. Tree diagrams in d3.js. Collapsible Force Layout. Christopheviau. Over 1000 D3.js Examples and Demos. Parerga und Paralipomena » Blog Archive » Messing around wih D3.js and hierarchical data. These days there are a lot of browser-oriented visualization toolkits, such d3.js or jit.js.
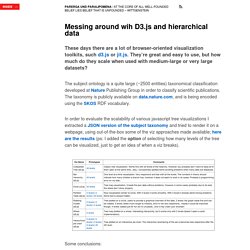
They’re great and easy to use, but how much do they scale when used with medium-large or very large datasets? The subject ontology is a quite large (~2500 entities) taxonomical classification developed at Nature Publishing Group in order to classify scientific publications. The taxonomy is publicly available on data.nature.com, and is being encoded using the SKOS RDF vocabulary. In order to evaluate the scalability of various javascript tree visualizations I extracted a JSON version of the subject taxonomy and tried to render it on a webpage, using out-of-the-box some of the viz approaches made available; here are the results (ps: I added the option of selecting how many levels of the tree can be visualized, just to get an idea of when a viz breaks). Creating Inheritance Diagrams for better documentation · Issue #6 · niloy/blog.
Threejs. Britzpetermann was commissioned to create an installation for the entrance hall that draws attention to the topic energy.
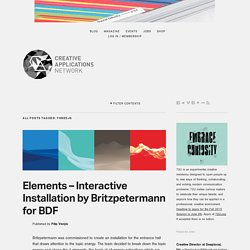
The team decided to break down the topic energy and chose the 4 elements, the basis of all energy extractions which are used in the park and present in an elegant and interactive way. Driven by the idea of a droplet of water following a line, Manny Tan created this Three.Js experiment that explores a droplet shape and it’s associated views in 3d space. The web application allows you to click and drag to rotate the shape. Alternatively, you can use the scroll wheel or right click and drag to move […] The Carp and the Seagull is an interactive short film about one man’s encounter with the spirit world and his fall from grace. A few months ago Michael Chang at Google Creative Labs was asked to make some visuals for Google IO, building on from the procedural circuit-board diagrams he did in the past.
Graph Visualization for Neo4j. Graph Visualization for Neo4j Goals This article reviews the different tools available for visualizing graph-based data.

Prerequisites You should have familiarized yourself with Graph Databases and the Property Graph Model. Beginner Overview Screencast: The Neo4j Browser Presentation: SVG-Based Graph Interaction Library: Alchemy.js Open Source… Learn More → Developer Working with Data. Generative Machines. D3 in 3D: Combining d3.js and three.js. Along with d3, the three.js library is one of the most powerful javascript libraries available for creating slick visualizations.
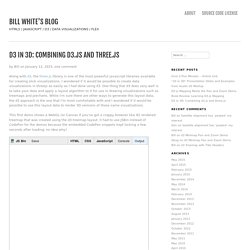
I wondered if it would be possible to create data visualizations in threejs as easily as I had done using d3. One thing that d3 does very well is to take your data and apply a layout algorithm to it for use in drawing visualizations such as treemaps and piecharts. While I’m sure there are other ways to generate this layout data, the d3 approach is the one that I’m most comfortable with and I wondered if it would be possible to use this layout data to render 3D versions of those same visualizations. This first demo shows a WebGL (or Canvas if you’ve got a crappy browser like IE) rendered treemap that was created using the d3 treemap layout: (I had to use JSBin instead of CodePen for the demos because the embedded CodePen snippets kept locking a few seconds after loading; no idea why)
Interactive 3D Graphics Course With Three.js & WebGL - Udacity. Making MathBox. Viewports, Primitives and Renderables At its core, Three.js matches pretty directly with WebGL.
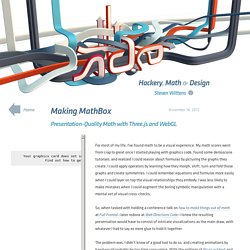
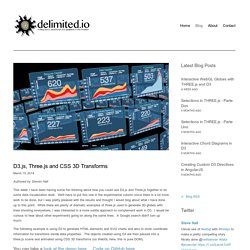
You can insert objects such as a Mesh, Line or ParticleSystem into your scene, which invokes a specific GL drawing command with high efficiency. As such, I certainly didn't want to reinvent the wheel. D3.js, Three.js and CSS 3D Transforms — delimited. PC Browsers.
Artist graph. Diagramming Components for HTML5/Canvas, by Northwoods Software® GoJS is a feature-rich JavaScript library for implementing interactive diagrams across modern web browsers and platforms.
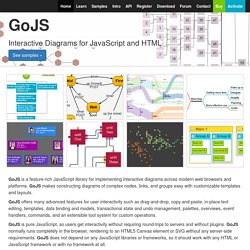
GoJS makes constructing diagrams of complex nodes, links, and groups easy with customizable templates and layouts. GoJS offers many advanced features for user interactivity such as drag-and-drop, copy-and-paste, in-place text editing, templates, data binding and models, transactional state and undo management, palettes, overviews, event handlers, commands, and an extensible tool system for custom operations.