
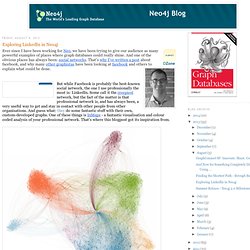
GraphML Primer. GraphML Primer is a non-normative document intended to provide an easily readable description of the GraphML facilities, and is oriented towards quickly understanding how to create GraphML documents.
This primer describes the language features through examples which are complemented by references to normative texts. (The GraphML Primer has been translated into Spanish language by Maria Ramos from Webhostinghub.com/support/edu.) 1 Introduction This document, GraphML Primer, provides an description of GraphML, and should be used alongside the formal descriptions of the language contained in the GraphML specification. The intended audience of this document includes application developers whose programs read and write GraphML files, and users who want to communicate with programs using GraphML import/export.
Section 2 covers the basic mechanisms of GraphML. Section 3 describes advanced graph models which include nested graphs, hyperedges, and ports. 2 Basic Concepts. Strata Gems: Make beautiful graphs of your Twitter network. We’re publishing a new Strata Gem each day all the way through to December 24.
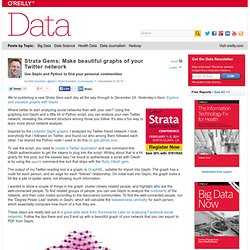
Yesterday’s Gem: Explore and visualize graphs with Gephi. Where better to start analyzing social networks than with your own? Using the graphing tool Gephi and a little bit of Python script, you can analyze your own Twitter network, revealing the inherent structure among those you follow. It’s also a fun way to learn more about network analysis. Inspired by the LinkedIn Gephi graphs, I analyzed my Twitter friend network. To use the script, you need to create a Twitter application and use command-line OAuth authentication to get the tokens to plug into the script.
The output of my Twitter-reading tool is a graph, in GraphML, suitable for import into Gephi. These steps are neatly laid out in a great slide deck from Sociomantic Labs on analyzing Facebook social networks. Overview of my social graph: click to view the full PDF version.
Gephi, an open source graph visualization and manipulation software. Downloads. Gephi is an open-source and multiplatform software distributed under the dual license CDDL 1.0 and GNU General Public License v3.
Official Releases Release Notes | System Requirements | Installation instructions. Gephi. SemanticWebImport. The Gephi Plugins Center has moved for the better!
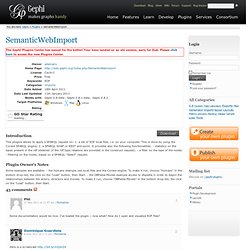
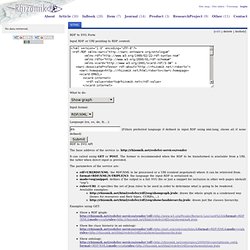
Your have landed on an old version, sorry for that. Please click here to access the new Plugins Center. Introduction This plugins allows to apply a SPARQL request on: 1. a set of RDF local files, i.e. on your computer. This is done by using the Corese SPARQL engine; 2. a SPARQL SOAP or REST end-point. Plugin Owner's Notes Some examples are available: - the humans example use local files and the Corese engine. Large-scale RDF Graph Visualization Tools. AI3 Assembles 26 Candidate Tools The pending UMBEL subject concept “backbone” ontology will involve literally thousands of concepts.
In order to manage and view such a large structure, a concerted effort to find suitable graph visualization software was mounted. This post presents the candidate listing, as well as some useful starting resources and background information. A subsequent post will present the surprise winner of our evaluation. Starting Resources Various Example Visualizations For grins, you may also like to see various example visualizations, most with a large-graph bent: Software Options Here is the listing of 26 candidate graph visualization programs assembled to date: Cytoscape – this tool, based on GINY and Piccolo (see below), is under active use by the bioinformatics community and highly recommended by Bio2RDF.org GINY implements a very innovative system for sub-graphing and allows for stunning visuals.
RDF to SVG - Rhizomik. Login Site map - Site index - Treemap.
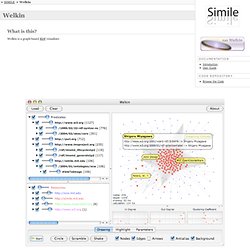
Visualize your LinkedIn network. GUESS: The Graph Exploration System. Mindmapping. Sgvizler : js RDF visualizer. Exploring LinkedIn in Neo4j. Ever since I have been working for Neo, we have been trying to give our audience as many powerful examples of places where graph databases could really shine.
And one of the obvious places has always been: social networks. That’s why I’ve written a post about facebook, and why many other graphistas have been looking at facebook and others to explain what could be done. But while Facebook is probably the best-known social network, the one I use professionally the most is: LinkedIn. Some call it the creepiest network, but the fact of the matter is that professional network is, and has always been, a very useful way to get and stay in contact with other people from other organisations.
And guess what: they do some fantastic stuff with their own, custom-developed graphs. An interactive InMap The thing is: the InMap above is a “static” picture of your network. Amazon. Large-scale RDF Graph Visualization Tools. Welkin. What is this?
Welkin is a graph-based RDF visualizer. What's New in Version 1.1 Works on Windows, Linux and MacOSX. Added support for Turtle/N3 RDF syntax. Dramatically reduced size for increased startup performance. Ok, how do I run it? The easiest way is to run Welkin thru Java WebStart. If the application doesn't start when you click the link above, you don't have Java WebStart installed in your machine.
Cool, now what? Welkin visualizes RDF models. A word of warning: above 1000 nodes, real-time drawing performance degrades dramatically even on beefy machines. How can I learn more about it? The best way is to read the Welkin User Guide. Where do I download it? Data visualisation. Data & Visualisation.