Rickshaw: A JavaScript toolkit for creating interactive time series graphs
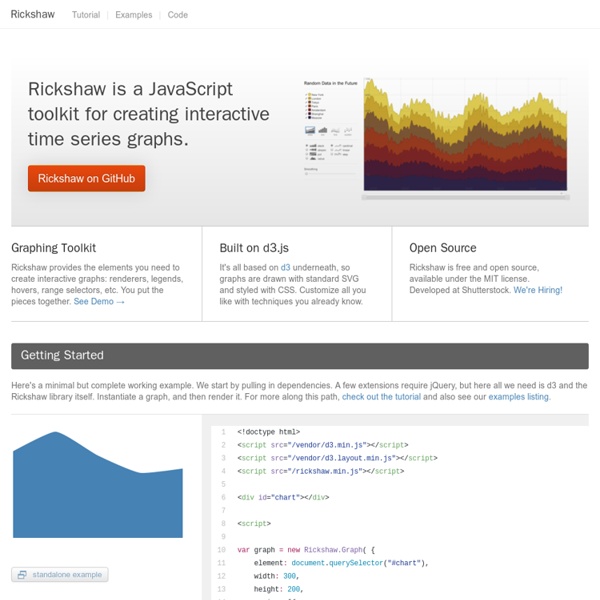
A suite of Javascript libraries and tools designed for working with HTML5
Recent Updates Follow @CreateJS November 2014 Added Unit Tests to EaselJSUpdates in preparation for new releases (coming soon). October 2014 Added 'Extras' to EaselJSTons of updates and pull requests in all libs July 2014 Major Updates to EaselJS Graphics The Story Why we built CreateJS About CreateJS CreateJS is a suite of modular libraries and tools which work together to enable rich interactive content on open web technologies via HTML5. Featured Projects Community Show & Tell. Ion Drift A port of the Flash game Ion Drift, b10b was able to build a CreateJS version in less than a day that hit target framerates on even the lowest devices, and outperformed ports to other libraries. By b10b b10b
CoffeeScript
PageSlide: a jQuery plugin which slides a webpage over to reveal an additional interaction pane
Advertisement a jQuery plugin which slides a webpage over to reveal an additional interaction pane by Scott Robbin Download PageSlide Now If you've ever used the mobile version of Facebook, or Path,then you've probably seen something akin to PageSlide in action. Clicking on a button or link slides the page over to reveal a hidden pane,one that usually contains secondary navigation, a form, or additional information. There are several ways to use PageSlide, some of which are shown below.Additionally, there is a responsive demo which shows how PageSlide can be used as a mobile solution. Slide to the right, and load content from a secondary page Slide to the left, and display hidden content from this page in a modal pane Modal This slide uses "modal" option set to "true". Where can I get it? If you are interested in learning more about PageSlide, it's recommended that you view the project on GitHub. Other jQuery Plugins If you like this plugin, feel free to check out some of the others I've built.
LESS « The Dynamic Stylesheet language
Lib
CodeKit — THE Mac App For Web Developers
Useful JavaScript and jQuery Tools, Libraries, Plugins - Smashing Coding
Advertisement Recently we’ve been receiving more requests for carefully selected, useful round-ups. We try to avoid round-ups on Smashing Magazine, but sometimes the format is useful and — if the resources are relevant — can be extremely helpful. Besides, we are glad to drive traffic to some obscure, yet useful resources and thus support the developers of these resources. In this round-up, you’ll find some of the useful JavaScript and jQuery tools, libraries and plugins that we have stumbled upon recently. You might want to take a look at the following related posts: Useful JavaScript Libraries Respond.js: Fast CSS3 Media Queries for Internet Explorer 6-8 and More5The goal of this script is to provide a fast and lightweight script to enable responsive Web designs in browsers that don’t support CSS3 Media Queries. Blackbird: Open Source JavaScript Logging Utility6Blackbird offers a dead-simple way to log messages in JavaScript and an attractive console to view and filter them. SlickGrid!
jQuery Performance Tips and Tricks
jQuery Performance Tips and Tricks Addy Osmani, AOL 18 July 2011 jQuery Proven Performance Tips & Tricks Performance optimisation is a crucial aspect of building ‘snappy’ client-side applications and something which all developers using jQuery should bear in mind. In Addy Osmani's (@addy_osmani) talk, he'll take a look at some of the best practices, tips and tricks for improving the performance of your jQuery code in 2011, with some quick wins and a few new surprises along the way. For more on Addy’s work, check out his official website AddyOsmani.com for tutorials, jQuery.com for his community updates and magazines such as .NET for his thoughts and commentaries. Performance optimisation is a crucial aspect of building ‘snappy’ client-side applications and something which all developers using jQuery should bear in mind.
Related:
Related:
