The Beat - Instagram Photos and What's Around Them - by the Rutgers Social Media Information Lab
About the Beat We use Instagram pictures users added to their map, and combine them with the corresponding Google StreetView location to help explore topics in a new way. Feel free to explore your own beat by putting a new topic in the search box. Privacy
Education
Project Noah was created to provide people of all ages with a simple, easy-to-use way to share their experiences with wildlife. By encouraging your students to share their observations and contribute to Project Noah missions, you not only help students to reconnect with nature, you provide them with real opportunities to make a difference. Once you're registered as a teacher, you can create a new place-based mission for your students. Get them excited about nature by experiencing wildlife observation first-hand.
Quick Story Idea Generator
Stories The theme of this story: dark quest. The main characters: unbalanced hero and humble secret agent.
40 Maps That Will Help You Make Sense of the World
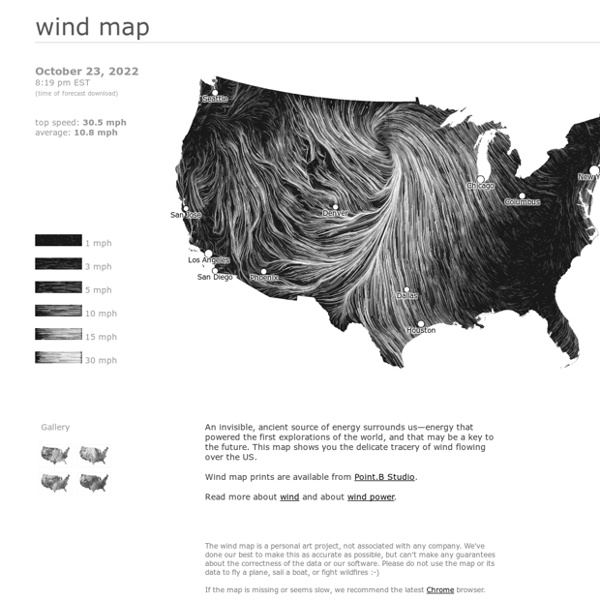
If you’re a visual learner like myself, then you know maps, charts and infographics can really help bring data and information to life. Maps can make a point resonate with readers and this collection aims to do just that. Hopefully some of these maps will surprise you and you’ll learn something new. A few are important to know, some interpret and display data in a beautiful or creative way, and a few may even make you chuckle or shake your head.
Lostalgic
Lostalgic This project is based on the entire ABC's LOST TV show scripts, 115 episodes in 7 seasons, that I managed to parse from Lostpedia. I also parsed this page with additional information about hidden characters relations. My aim for this project is not (only) to visualize some properties and patterns out of the script but actually to allow to read and enjoy the series in a different way.
Domestic Violence: Can your smartphone save your life?
Erasing domestic violence with a swipe of the finger? There’s an app for that. From apps to combat cyberstalking and real life domestic abuse, to using existing popular Facebook features, hundreds of volunteer developers contributed their time and talent to create online solutions against domestic violence during a weekend hackathon spanning two continents.
Biology - Homework and Study Help - Free help with your Biology homework
Can I take a course at HippoCampus for credit? How do I enroll in a course at HippoCampus? Are there any fees to take your courses? How do I make a comment or ask a question?
13 killer Chrome apps to replace your desktop software
When Tim Berners-Lee invented the first Web browser in 1990, it was just an application made to read HTML pages passively. Fast-forward to today, and the modern Web browser has become a powerful platform in itself—almost a miniature operating system, capable of running complex JavaScript code and interacting with Flash plug-ins. Indeed, Web pages have evolved into Web apps, to the point where we can do much of our productivity work in a browser window without ever having to invest in traditional desktop software. But how much work can you really do from a browser? Could you replace all of your desktop apps with Chrome extensions, and be none the worse for wear?
Everything Sings - Siglio Press
Intro by Ira Glass, essays by Albert Mobilio and Ander Monson, interview by Blake Butler. That a cartographer could set out on a mission that’s so emotional, so personal, so idiosyncratic, was news to me. —IRA GLASS, host of This American Life, from his introduction to Everything Sings. Iconoclastic geographer Denis Wood has created an atlas unlike any other. He surveys his small, century-old neighborhood Boylan Heights in Raleigh, North Carolina by first paring away the inessential (scale, orientation, street grids), then by locating the revelatory in the unmapped and unmappable: radio waves permeating the air, the paperboy’s route in space and time, the light cast by street lamps, Halloween pumpkins on porches.
Map your moves
Data This map distills more than 4000 moves from over 1700 people, collected in an informal survey by WNYC, a New York based public radio station. For generating the geo–coordinates from the entered ZIP codes, I used the free bulk geocoder at gpsvisualizer.com. I did not check every single data row in detail, so a few of the moves might be misrepresented. Mapping
Iran: A Crime on YouTube, an Execution in Public
Two young men, Alireza Mafiha and Mohammad Ali Sarvari, were executed by hanging in Tehran, Iran in the early hours of January 20, 2013 before the eyes of public spectators [warning: graphic photos] who had gathered to watch, according to the Islamic Republic News Agency (IRNA). Crime and YouTube The hunt for the alleged muggers was given top priority after security camera footage was posted on YouTube towards the end of 2012 showing four youths on two motorbikes who ambushed a pedestrian, threatening him with a knife and taking his belongings.
Lichtenwalner, Megan (Science) / Biology Keystone Exam Resources
Starting with the class of 2017, a graduation component of any Pennsylvania public school will be passing specific Keystone exams. These exams are designed to make sure that students are meeting state standards. Starting with the 2012-2013 school year, Council Rock School District will be administering the Algebra I, Literature, and Biology Keystone exam. To help students review the topic of biology, the Science Department has broken up the content into 9 topics. Review for each topic will consist of the following: