
How to make awesome interactive map using Google Sheets in under 1 minute? - Geoawesomeness. Danmark set fra Luften - Det Kongelige Bibliotek. Historisk Atlas. Spatial Suite mobile. SDFE-kortviewer. Create map. GPS, tracks, spor, ruter og Converter funktion. Earth. Danny Dorling: Maps that show us who we are (not just where we are) Daily Overview. Kort 25: Print dit eget 4-cm kort. Ventusky - Wind, Rain and Temperature Maps.
Timelapse – Google Earth Engine. Topotijdreis: 200 jaar topografische kaarten. Indy100.independent.co. The official campaign period for the upcoming EU referendum begins on April 15th.
But as all of us poor b-----ds already know, Brexit stats trying to persuade us to vote In or Out are already flying about all over the place. If you're already tired of the Brexit rhetoric, indy100 has taken a look back at our own data from stories about Europe to date. Whatever your opinion on the EU, these facts and figures are food for thought: 1. France hates its leader more than other European countries. If It Were My Home.
Atlas for a Changing Planet. Understanding natural and human systems is an essential first step toward reducing the severity of climate change and adapting to a warmer future.
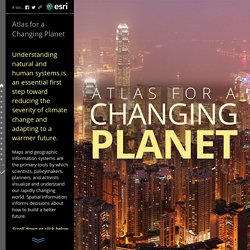
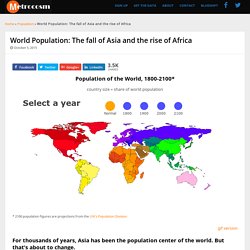
Maps and geographic information systems are the primary tools by which scientists, policymakers, planners, and activists visualize and understand our rapidly changing world. Spatial information informs decisions about how to build a better future. World Population: The fall of Asia and the rise of Africa. Population of the World, 1800-2100* country size = share of world population * 2100 population figures are projections from the UN’s Population Division gif version For thousands of years, Asia has been the population center of the world.
32 maps that will teach you something new about the world. EVER THOUGHT TO YOURSELF, “How many smaller countries could you fit into Australia?”
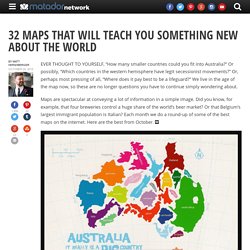
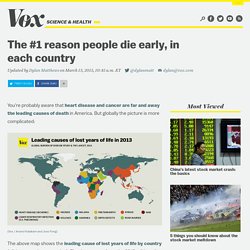
Or possibly, “Which countries in the western hemisphere have legit secessionist movements?” Or, perhaps most pressing of all, “Where does it pay best to be a lifeguard?” We live in the age of the map now, so these are no longer questions you have to continue simply wondering about. 5 tip, der gør dine Google Fusion kort bedre - Kaas & Mulvad. AboutModal?borders=1~!MTUxMjE0MDQ. The #1 reason people die early, in each country. You're probably aware that heart disease and cancer are far and away the leading causes of death in America.
Climate Change Knowledge Portal 2.0. MapGive. OpenStreetMap. Science On a Sphere. EarthViewer. Michael Pecirno's Minimal Maps Single Out American Land Use Patterns. Most maps of the U.S. prioritize metropolitan areas.
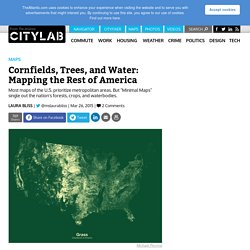
But "Minimal Maps" single out the nation's forests, crops, and waterbodies. Eighty percent of the U.S. population lives in "urban" areas, a staggering 249,253,271 souls. Yet these folks live in just 3 percent of the country's 2.3 billion acres of land. Most of America's 50 states are forestland (30 percent), pasture and ranges (27 percent), and crops (18 percent), with parks, tundra, and swamps making up the rest.
These are statistics that never fail to blow my provincially urban mind—in part, perhaps, because most maps of the country visually prioritize metropolitan areas. But London-based designer Michael Pecirno produces images of America that illuminate all land use patterns, type by type. "[C]orn fields take up 91 million acres of the American landscape," writes Pecirno in an email. All images courtesy of Michael Pecirno. GST-kort. Geodatastyrelsen. Brugstedet.dk. Kort på nettet. 9 Excellent Free Map Creation Tools for Teachers and Students. 1- Umapper UMapper is a great mapping tool for educators.
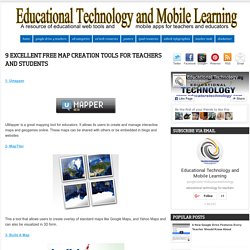
It allows its users to create and manage interactive maps and geogames online. These maps can be shared with others or be embedded in blogs and websites. Google Maps Engine. Story Maps. Google Earth Placemarks mm. 38 maps that explain Europe. Everything Sings - Siglio Press. Intro by Ira Glass, essays by Albert Mobilio and Ander Monson, interview by Blake Butler.
An animated map of global wind and weather. World by Map: Statistics, Maps and Charts. ChartsBin.com - Visualize your data. Wind Map. An invisible, ancient source of energy surrounds us—energy that powered the first explorations of the world, and that may be a key to the future.

This map shows you the delicate tracery of wind flowing over the US. The wind map is a personal art project, not associated with any company. We've done our best to make this as accurate as possible, but can't make any guarantees about the correctness of the data or our software. Please do not use the map or its data to fly a plane, sail a boat, or fight wildfires :-) If the map is missing or seems slow, we recommend the latest Chrome browser. Surface wind data comes from the National Digital Forecast Database. If you're looking for a weather map, or just want more detail on the weather today, see these more traditional maps of temperature and wind. 40 Maps That Will Help You Make Sense of the World. If you’re a visual learner like myself, then you know maps, charts and infographics can really help bring data and information to life. Maps can make a point resonate with readers and this collection aims to do just that.
Hopefully some of these maps will surprise you and you’ll learn something new. A few are important to know, some interpret and display data in a beautiful or creative way, and a few may even make you chuckle or shake your head. If you enjoy this collection of maps, the Sifter highly recommends the r/MapPorn sub reddit. You should also check out ChartsBin.com. Map Projection Transitions. Mercator Puzzle! Worldmapper: The world as you've never seen it before. MapFight - compare country size. Geocortex Viewer for Silverlight. Miljøgis.