

A List of The Best Free Digital Storytelling Tools for Teachers 1- ZimmerTwins It is all about creative storytelling. ZimmerTwins is a web2.0 tool that allows students to give vent to their imaginative powers and exercise their storytelling skills from early stages to advances ones. 2- Digital Story Telling in The Classroom This section provides resources and materials for teachers to use with their students in storytelling. Mosaic Maker: A world of creative photo possibilities. Tons of fun stuff... Give one of our toys a spin! Framer, FX, Trading Card, Mosaic Maker, CD Cover, Photobooth, Bead Art, Magazine Cover, Billboard, Mosaic Maker, Color Palette Generator, Mosaic Maker, Calendar, Lolcat Generator, Cube, Pop Art Poster, Mat, Hockneyizer, Movie Poster, Motivator, Jigsaw, Wallpaper, Map Maker, Pocket Album, Badge Maker, I know, right? It's a lot to take in. Go slow.
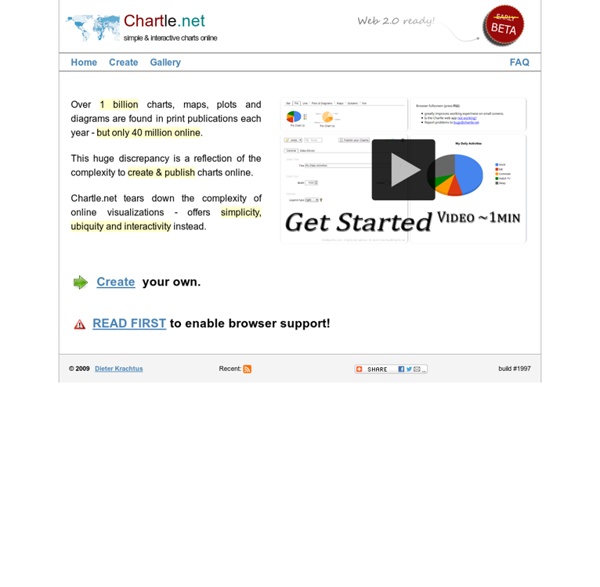
22 Useful Online Chart & Graph Generators Have you ever encounter situations where you need to create a simple yet good-looking chart, graphs or diagrams and all you have is your browser? Charts are good and effective way to show relationship between entities but sometimes creating one can be pretty challenging especially when your favorite word processing software is not around. In today’s post, we want to highlight some of the best web services that allow you to create various charts and graphs online on-the-fly. Make Beliefs Comix For Educators How to Play with MakeBeliefsComix.com How to Play: For Educators Click here to watch a video of students at City College, New York, talking about how MakeBeliefsComix.com helps them learn English. Their instructor, Tamara Kirson, was named The New York Times 2009 ESOL Teacher of the Year. To see her lesson plan click here.
CSS Chart Generator - create CSS Charts on the fly! Below you can enter all the necessary information for your chart. The single items are explained and predefined, so you can simply start changing values. When you are done adding your values, simply click the send button and your chart will be generated in no time and you will receive a link which you can use to display the chart on your page. Please note, the animation effect is not included, but you can download the necessary ajax code. The free version shows a copyright notice in the x-axis title, while the pro version is free from any backlinks or ads and has much more functionality. It has not the ability to use gradient images or any other cool stuff. Create An Interactive, Label-Based Image Quiz! Thanks to Larry Ferlazzo for sharing this resource! ImageQuiz is a fantastic new website that lets users create image-based quizzes with ease. Just upload your image, choose a title, and begin tagging the locations of the labels. Tagging works by drawing on the image to define what the quiz should test people on, and then labeling each of those tags.
Motivator: Create your own motivational posters! First time here? Welcome! We have a lot of fun stuff to play with like ourMotivational Poster maker, Magazine Cover maker, Pop Art poster, and much more! Play as much as you like—everything is free. 10 Useful Flash Components for Graphing Data By Jacob Gube Flash is an excellent technology for dealing with data visualization. It being client-side, it can reduce the amount of work your server has to perform in order to generate graphs and charts. Plant a Question, Grow Answers Topic (required) Type the topic of your new AnswerGarden. This can be a question or a topic, such as: "What do you think of my website?" More options (optional) For your convenience, you can change the following settings for your new AnswerGarden.
Create Organizational Charts Online using Org Chart Software Org Chart Software Packed with Features Our org chart specific features like filtering makes it super easy to add/remove fields from your entire org chart in 1 click. This means you can do things like show telephone no to HR department while hiding the contact details to rest of the company in one single click. This helps you to maintain one org chart and show/hide details as necessary when distributing the org chart. Announcing: Connect To The Revolution, an Ebook by Glogster EDU Well, it’s been a voyage of discovery. Glogster EDU has grown by leaps and bounds in the past few years, and it has been a joy to be here, and to learn from every EDUcator and student using Glogster EDU for creative, innovative teaching and learning. At Glogster EDU, we believe that education truly lasts a lifetime, and that it never ends. That’s why we keep learning and growing every day.
Graph Maker online The most powerful free instrument to create stunning graphs is Google Online Graph Maker Charts supported: bar charts Introduction XML/SWF Charts is a simple, yet powerful tool to create attractive charts and graphs from XML data. Create an XML source to describe a chart, then pass it to this tool's flash file to generate the chart. The XML source can be prepared manually, or generated dynamically using any scripting language (PHP, ASP, CFML, Perl, etc.)
Writeboard Hello, We launched Writeboard back in October of 2005 as a stand-alone service. A few years later we integrated Writeboards into Basecamp Classic and Backpack. Today, the vast majority of Writeboards are created inside those two products. As part of refocusing on Basecamp, we’ve decided to retire Writeboard.com.