The Best Data Visualization Projects of 2014
It's always tough to pick my favorite visualization projects. I mean, it's a challenge to pick and rank your favorite anything really. So much depends on what you feel like at the time, and there's a lot of good work out there.
30 Basic Tools For Data Visualization
Posted on FastCodeDesign. iCharts iCharts is a platform that connects the publishers of market research, economic and industry data with professional consumers. iCharts hosts tens of thousands of charts in business, economy, sports, and other categories. iChart makes it simple for people to discover and follow the world’s latest data insights. iCharts provides cloud-based and patented charting tool that enable companies and individuals to brand, market, and share their data as chart content to millions of viewers across the web. icharts provides free accounts to the users which let you create basic interactive charts, while you can buy the premium version as well with tons of features. Charts can have interactive elements, and can pull data from Google Docs, Excel spreadsheets, and other sources. [Link] Click here to view similar graphics.
webcomic, page 196
14 October. 2014 Language trees for the language lovers! I've gathered pretty much all the data for this from ethnologue.com, which is an awesome well of information about language families. And if anyone finds some important language missing let me know!
Top wireframing tools - Digital Nation
by Claudia Sagripanti on Jun 28, 2012 with 4 Comments I’m involved with Metro Screen’s MetroAppsLab – a mini hackathon/lab for mobile apps development. Oliver Weidlich of Mobile Experience came in and gave a great presentation on wireframing – a how-to and why. 7 reasons to use wireframes in mobile app design To create the skeleton of the applicationTo progress sketches to higher fidelityTo formally plan out the interaction between the screens in more detail and all the functionalityInvestigate different pathsTo use more accurate relative sizingTo use OS elementsCreate assets for usability testing
about d3.js
by Yosiya Hinosawa スライドの URL: D3.js とは・・・ ブラウザ向け javascript のライブラリ Data Visualization 用途 (グラフ、チャート etc...) minify して 140+KB D3.js
30 Simple Tools For Data Visualization
There have never been more technologies available to collect, examine, and render data. Here are 30 different notable pieces of data visualization software good for any designer's repertoire. They're not just powerful; they're easy to use. In fact, most of these tools feature simple, point-and-click interfaces, and don’t require that you possess any particular coding knowledge or invest in any significant training.
8 tools for visualizing data with open source
Data visualization is the mechanism of taking tabular or spatial data and conveying it in a human-friendly and visual way. There are several open source tools that can help you create useful, informative graphs. In this post we will take a look at eight open source, data visualization tools. Datawrapper Datawrapper was created by journalism organizations from Europe, designed to make data visualization easy for news institutes.
The 25 Best Data Visualizations of 2018
Making information beautiful is an art form. Here at Visme, we are huge fans of what data artists are constantly creating. From data journalism to data art and data science in between. Last year, we published a roundup of the best data visualizations of 2018 and you loved it. For that reason, we are back with another installment of our favorite data viz of 2019. We hope you like the examples we have chosen.
Social Network Analysis
After learning the basics of R, I decided to learn something harder last week. I picked Social Network Analysis (SNA) to learn the concepts of SNA and R. My primary interest in SNA is visual exploration of networks, so I needed to find a tool first. Which tool to use for visual SNA? Features needed:
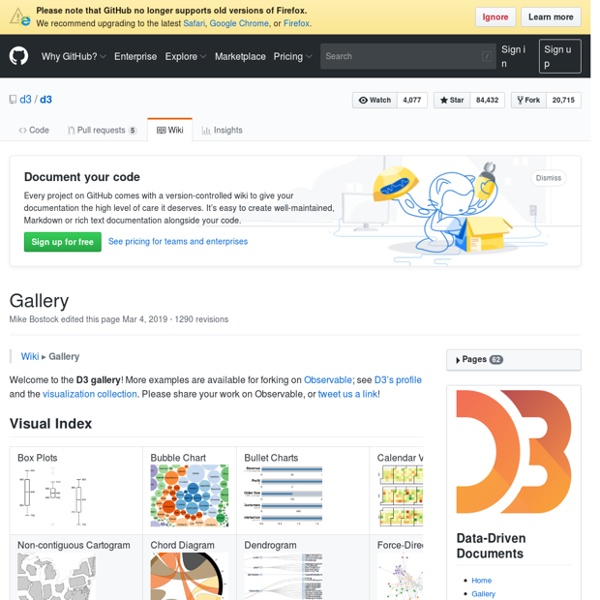
Tutorials · mbostock/d3 Wiki
Wiki ▸ Tutorials Please feel free to add links to your work!! Tutorials may not be up-to-date with the latest version 4.0 of D3; consider reading them alongside the latest release notes, the 4.0 summary, and the 4.0 changes. Introductions & Core Concepts