

d3: adding stuff. And, oh, understanding selections. From data to graphics d3 and protovis are built around the same principle.
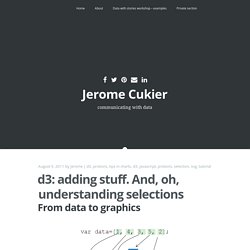
Take data, put it into an array, and for each element of data a graphical object can be created, whose properties are derived from the data that was provided. Only d3 and protovis have a slightly different way of adding those graphical elements and getting data. In protovis, you start from a panel, a protovis-specific object, to which you add various marks. Each time you add a mark, you can either: not specify data and add just one, or specify data and create as many as there are items in the array you pass as data. How de did it in protovis you first create a panel (first line), you may add an element without data (here, another panel, line 2), and add to this panel bars: there would be 5, one for each element in the array in line 4. And in d3? Data Visualization Libraries Based on D3.JS - Mike McDearmon.
There are a lot of ways to visualize data on the Web (with more emerging every day), but the flexibility, versatility, and energized development community surrounding D3.js makes it a great option to explore.
The following list of D3 plugins, extensions, and applications below is by no means comprehensive, but oughta be enough to keep you busy for a while. If you’re just getting your feet wet with D3.js, here are some great learning resources to get you acclimated:D3 for mere mortals: Great introductory lessons for those starting from scratch.Try D3 Now: Another great resource for learning about core D3 concepts.Data-Driven Documents (paper): An academic article by Mike Bostock with loads of footnotes.Learning D3, Scott Becker: A quick and effective tutorial series to get yourself up and running.Dashing D3: A very thorough tutorial series covering a LOT more than just D3.Interactive Data Visualization for the Web is a fantastic book by Scott Murray.
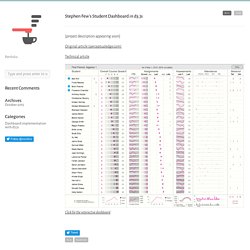
Graphgen - Graph generation engine by GraphAware. Stephen Few’s Student Dashboard in d3.js. Portfolio Recent Comments Archives October 2015 Categories.
How to learn D3.js.
Shelby Sturgis February 10, 2014 For those of you familiar with Elasticsearch, you know that its an amazing modern, scalable, full-text search engine with Apache Lucene and the inverted index at its core.
Elasticsearch allows users to query their data and provides efficient and blazingly fast look up of documents that make it perfect for creating real-time analytics dashboards. Currently, Elasticsearch includes faceted search, a functionality that allows users to compute aggregations of their data. For example, a user with twitter data could create buckets for the number of tweets per year, quarter, month, day, week, hour, or minute using the date histogram facet, making it quite simple to create histograms. Faceted search is a powerful tool for data visualization. Aggregations (=Awesomeness!) Aggregations is "faceting reborn". Using Aggregations for Data Visualization (with D3) Lets dive right in and see the power that aggregations give us for data visualization.
Requirements: <! ... Bl.ocks.org - mbostock. Hi! I’m Mike Bostock, creator of D3.js and a former graphics editor for The New York Times. I do data visualization, design and open source. AMA! : dataisbeautiful. Ease()-y as Math.PI. This is a presentation I gave at the Eyeo Festival in Minneapolis on June 11, 2014, adapted for the web.
The talk was entirely live-coded in the JavaScript console, an experience I’ve tried to recreate here. I recommend viewing this in Chrome, with the developer tools open. Click the next button to step through the presentation. Or, of course you can retype any of the code directly into the console yourself. Click any code block to execute it (but note that running them out of the intended order may produce unexpected results). Next > Hi! Let me show you what I mean. d3.select("#intro") With this code, we select an existing div with the ID of intro. OK, nothing changed. d3.select("#intro").style("background-color", "red") After running that code, open the DOM inspector and note that #intro now has a background color applied to it.
We can set any other CSS property using the same technique. d3.select("#intro").style("font-family", "Helvetica") Then we change the font color: Colors · mbostock/d3 Wiki. Wiki ▸ API Reference ▸ Core ▸ Colors Constructing visualizations often involves working with colors.
Even though your browser understands a lot about colors, it doesn't offer much help in manipulating colors through JavaScript. D3-based reusable chart library. In this guide, we are going to show you how to get started with C3. 1.
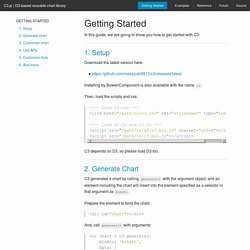
Setup Download the latest version here: Installing by Bower/Component is also available with the name c3. Then, load the scripts and css: C3 depends on D3, so please load D3 too. 2. C3 generates a chart by calling generate() with the argument object, and an element including the chart will insert into the element specified as a selector in that argument as bindto. Prepare the element to bind the chart: And, call generate() with arguments: C3 supports the asynchronous module definition (AMD) API. Bl.ocksplorer.org - Learn d3.js by Example. D3 Tutorial Table of Contents.