
- StumbleUpon. Touch Effects. Wonderfl build flash online. Fluid Motion Simulations and Artwork. When a droplet falls into shallow water, it creates a crown or "coronet".
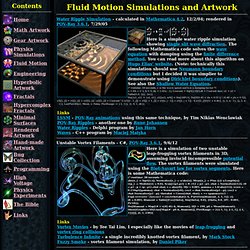
This droplet simulation was calculated using Smoothed Particle Hydrodynamics (SPH). SPH is one of the most impressive-looking fluid simulation techniques. Droplet Links Liquid Sculpture - beautiful high speed photographs, by Martin Waugh, see also this video Water Figures - beautiful high-speed camera splashes by Fotoopa Other Links Fluids v.1 - fast SPH C++ program by Rama Hoetzlein Physics Demos - fluid Java applets by Grant Kot Fluid Animations - amazing animations by Ron Fedkiw, with Eran Guendelman, Andrew Selle, Frank Losasso, et al. Visualization - Relevance. Track Mouse Activity On Your Computer. Enhancing the Visualization of Characteristic Structures in Dynamical Systems. A visual exploration on mapping complex networks. The Product Space and the Wealth of Nations. The concept of proximity formalizes the intuitive idea that the ability of a country to produce a product depends on its ability to produce other ones.
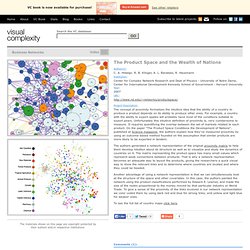
For example, a country with the ability to export apples will probably have most of the conditions suitable to export pears. Unfortunately this intuitive definition of proximity is, very cumbersome to measure. It requires quantifying the overlap between the set of markets related to each product. On the paper "The Product Space Conditions the Development of Nations", published at Science magazine, the authors explain how they've measured proximity by using an outcome based method founded on the assumption that similar products are more likely to be exported in tandem. The authors generated a network representation of the original proximity matrix to help them develop intuition about its structure as well as to visualize and study the dynamics of countries on it. To see the full list of country maps click here.
SML Pro Blog: Product Space + Wealth of Nations = Visualizing Economics. Impuregallery's Photostream. Human embryo link to fish ancestors. Visualizing Music. Www.flong.com/storage/images/projects/self-adherence. Moodle development visualization 1/3. Gource visualisation tool. Gource is a software version control visualization tool.
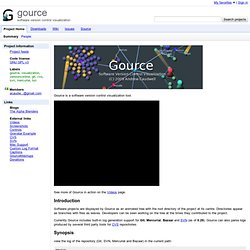
See more of Gource in action on the Videos page. Introduction Software projects are displayed by Gource as an animated tree with the root directory of the project at its centre. Directories appear as branches with files as leaves. Developers can be seen working on the tree at the times they contributed to the project. Currently Gource includes built-in log generation support for Git, Mercurial, Bazaar and SVN (as of 0.29). Synopsis view the log of the repository (Git, SVN, Mercurial and Bazaar) in the current path: gource Donations If you like Gource and would like to show your appreciation and encourage future work on this and other open source projects by the author, please consider making a donation! Bitcoin: 15WP34zkaZFJCyzCAKLt9qrWSvDuBN7XLv Related Software You may also want to check out Logstalgia, a web server access log visualization tool. News 14 April 2014 Gource 0.41 has been released. Changes since 0.40: 26 April 2013 11 January 2013.
Visualising Subversion with Gource. Over the weekend I stumbled across a video link, released (I assume) by Flickr.
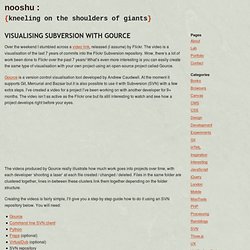
The video is a visualisation of the last 7 years of commits into the Flickr Subversion repository. Wow, there’s a lot of work been done to Flickr over the past 7 years! What’s even more interesting is you can easily create the same type of visualisation with your own project using an open-source project called Gource. Gource is a version control visualisation tool developed by Andrew Caudwell. At the moment it supports Git, Mercurial and Bazaar but it is also possible to use it with Subversion (SVN) with a few extra steps.
The videos produced by Gource really illustrate how much work goes into projects over time, with each developer ‘shooting a laser’ at each file created / changed / deleted. Creating the videos is fairly simple, I’ll give you a step by step guide how to do it using an SVN repository below. First you will want to grab a copy of Gource and extract the zip file to somewhere easily accessible. Human embryo link to fish ancestors BBC - 980 - shoogleit.com.