
25 must-see Summer Music Festivals in Europe. Summer is here and the best musical events are just around the corner.
That's why the CartoDB team made a list of the 25 must-see music festivals in Europe based on the festivalsearcher.com list and ordered by the lineup rank. This is a demo of what you can build using Oydssey.js, a library for building interactive stories created by CartoDB with the support of the Knight Foundation. Oydssey.js is an open-source tool that allows you to combine maps, narratives, and other multimedia into a beautiful story. A simple way for journalists, designers and creators to weave interactive stories.
When: 22-24 August Where: Reading, United Kingdom Performances: Artic Monkeys, Foster The People, Queen Of The Stones Age, Papa Roach, Blink-182, The Orwells, You Me At Six, and others. Nutrient Parallel Coordinates. Index.html# <!
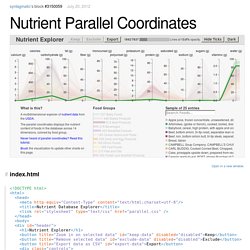
DOCTYPE html><html><head><meta http-equiv="Content-Type" content="text/html;charset=utf-8"/><title>Nutrient Database Explorer</title><link rel="stylesheet" type="text/css" href="parallel.css" /></head><body><div id="header"><h1>Nutrient Explorer</h1><button title="Zoom in on selected data" id="keep-data" disabled="disabled">Keep</button><button title="Remove selected data" id="exclude-data" disabled="disabled">Exclude</button><button title="Export data as CSV" id="export-data">Export</button><div class="controls"><strong id="rendered-count"></strong>/<strong id="selected-count"></strong><div class="fillbar"><div id="selected-bar"><div id="rendered-bar"> </div></div></div> Lines at <strong id="opacity"></strong> opacity.
Parallel.css# Sortable Heatmap. Days-Hours Heatmap. Days-Hours Heatmap This example is inspired by Calendar View and Trulia Trends.
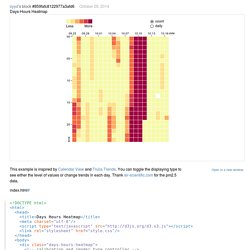
You can toggle the displaying type to see either the level of values or change trends in each day. House Hunting All Day, Every Day - Trulia Insights. Pictogram grid in d3js. Pictograms, or isotypes, in the form of repeating icons, can be used to effectively contrast quantity/magnitude comparisons in infographics and data visualisation.
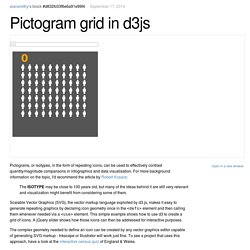
For more background information on the topic, I'd recommend the article by Robert Kosara: The ISOTYPE may be close to 100 years old, but many of the ideas behind it are still very relevant and visualization might benefit from considering some of them. Scalable Vector Graphics (SVG), the vector markup language exploited by d3.js, makes it easy to generate repeating graphics by declaring icon geometry once in the <defs> element and then calling them whenever needed via a <use> element. This simple example shows how to use d3 to create a grid of icons. A jQuery slider shows how those icons can then be addressed for interactive purposes. Day / Hour Heatmap. Streamgraph. Coffee Flavour Wheel. Click to zoom!
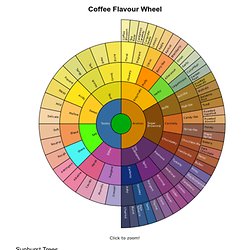
Sunburst Trees This is an example of using d3.layout.partition to generate a zoomable sunburst tree derived from hierarchical data. A sunburst tree is a radial space-filling visualisation, analagous to an icicle tree. Colours The original colours appear to have been selected by the designer, as opposed to matching any standard colour name palettes.
The inner node colours are calculated automatically by taking the average of the two child nodes in HSL colour space. Labels The label colour of black or light grey is automatically chosen by calculating the colour brightness of each node. Credits The original coffee flavour wheel was created by the Specialty Coffee Association of America in poster form but it appears in various places on the Web. …a flavor wheel created in 1997 by the Specialty Coffee Association of America, the Colombian Coffee Federation, and Jean Lenoir. Hyperlinks in d3.js objects. How to make force layout graph in D3.js responsive to screen/browser size. Whats the best way to make a d3.js visualisation layout responsive. Clear Congress Project. d3 + raphael Examples: d34raphael.
RaphaelJS Clickable USA Map. SVG To RaphaelJS Converter - Ready.Set.Raphael. Beta 2. Over 1000 D3.js Examples and Demos. Rounded Rectangle. Timely Portfolio. Concept map. D3.js Tutorials, Screencasts and a Newsletter. A fascination with xml maps. Fig 1 - MapD Twitter Map 80M tweets Oct 19 - Oct 30 Visualizing large data sets with maps is an ongoing concern these days.
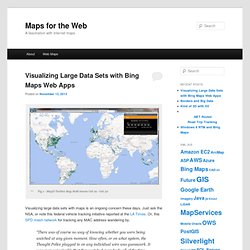
Just ask the NSA, or note this federal vehicle tracking initiative reported at the LA Times. Or, this SPD mesh network for tracking any MAC address wandering by. “There was of course no way of knowing whether you were being watched at any given moment. How often, or on what system, the Thought Police plugged in on any individual wire was guesswork. George Orwell, 1984 On a less intrusive note, large data visualization is also of interest to anyone dealing with BI or just fascinated with massive public data sets such as twitter universe. 1. All web map javascript APIs have these same issues whether it’s Google, MapQuest, Nokia Here, or Bing Maps.
Web Mapping Limitation Bing Maps Ajax v7 is Microsoft’s javascript API for web mapping applications. Although this is a powerful mapping API rendering performance degrades with the number of vector entities in an overlay. How to convert d3.js SVG to PDF « Work Updates. By Sergiy Nesterko on January 30th, 2012 Consider the following plot: The image above is an SVG created using d3.js.
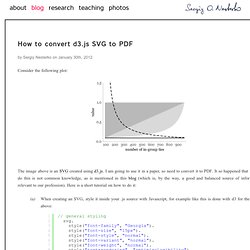
I am going to use it in a paper, so need to convert it to PDF. It so happened that how to do this is not common knowledge, as is mentioned in this blog (which is, by the way, a good and balanced source of information relevant to our profession). Here is a short tutorial on how to do it: When creating an SVG, style it inside your .js source with Javascript, for example like this is done with d3 for the image above: Then open the webpage containing the SVG in your browser (I am using Chrome most of the time, for example), open Javascript console (use Alt-Command-i if you are on a Mac to open developer tools and click Console), paste in this code and press Enter: Credit for this code snippet goes to Chris Viau.
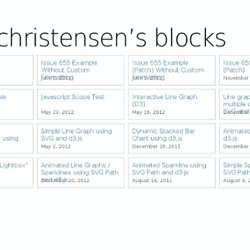
By the way, you can practice on this page. Tags: d3, homophily, Joe, visualization. Hierarchy for D3.js. Iain Dillingham. Bl.ocks.org - benjchristensen. Example of RxJava being used with Java 8 lambdas March 9, 2013 Basic RxJava-Scala examples February 8, 2013 Example of using RxJava in Groovy to compose nested asynchronous calls.
January 31, 2013 Example of using RxJava in Groovy to compose nested asynchronous calls. January 31, 2013 CallbackB.java Example of using Callbacks for nested calls showing the incidental complexity that results and how eventually the asynchronous paths need to be synchronized together. January 30, 2013 Simple example of applying Rx operators to an asynchronous Observable sequence. February 1, 2013 Simple example of applying Rx operators to an asynchronous Observable sequence.
February 1, 2013 Observable Method that optionally uses a thread to fetch data if not available in memory. Loading; one moment please… D3 Presentation. "Stuttering" drag when using d3.behavior.drag() and transform. Data Visualization with D3.js. Lab Rat Revenge. How does Hubway help you get around Boston faster? Visualizations – Our Most Popular Creations. Bl.ocks.org - mbostock.
Force Test. General Update Pattern, III. By adding transitions, we can more easily follow the elements as they are entered, updated and exited.
Separate transitions are defined for each of the three states. Note that no transition is applied to the merged enter + update selection; this is because it would supersede the transition already scheduled on entering and updating elements. It's possible to schedule concurrent elements by using transition.transition or by setting transition.id, but it's simpler here to only transition the x-position on update; for entering elements, the x-position is assigned statically. Want to read more? Try these tutorials: D3.js. Programming. I thought this would be a simple task.
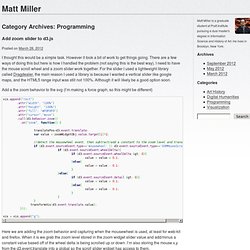
However it took a bit of work to get things going. There are a few ways of doing this but here is how I handled the problem (not saying this is the best way). I need to have the mouse scroll wheel and a zoom slider work together. For the slider I used a lightweight library called Dragdealer, the main reason I used a library is because I wanted a vertical slider like google maps, and the HTML5 range input was still not 100%. Although it will likely be a good option soon.
Add a the zoom behavior to the svg (I’m making a force graph, so this might be different) Here we are adding the zoom behavior and capturing when the mousewheel is used, at least for web-kit and firefox. ZoomFactor is a constant you can set to set the initial zoom level. And then in the zoom widget or range input update you would call transformVis with its stored value.
The updateGraph function does the d3 stuff, it calls this function to get the new data object: