
Lelieuunique – Le point de vue de nulle part. Vernissage jeudi 5 avril 2018 à 18h.
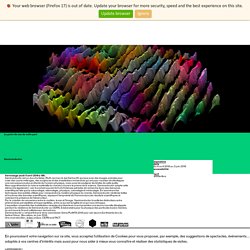
Semiconductor est un duo d’artistes (Ruth Jarman & Joe Gerhardt) qui joue avec des images animées pour créer des courts-métrages, des sculptures et des installations immersives qui ont pour vocation de développer une connaissance plus profonde de l’univers physique, mais aussi de souligner les limites de cette quête. Nous appréhendons la nature matérielle du monde à travers le prisme de la science. Semiconductor adopte cette démarche également : son travail est souvent le fruit d’intenses périodes de recherche dans des domaines scientifiques tels que la volcanologie, séismologie, physique, cosmologie et minéralogie.
Vous êtes prêts ? Voici tout ce que Facebook et Google savent sur vous. L’archivage de nos données personnelles par les géants du web va bien plus loin que nous l’imaginons.
L’auteur de cet article, un développeur et data journaliste, a mené l’expérience sur lui-même. Vous voulez vous flanquer la frousse ? Je vais vous montrer toutes les informations que des sites du genre Facebook et Google détiennent à votre sujet, sans que vous le sachiez. Google sait où vous étiez Google archive votre localisation (si votre système de localisation est activé) chaque fois que vous allumez votre portable. Digital archiving: the seven pillars of metadata. Two of the key challenges facing The National Archives in the digital age are the need to provide new ways of accessing digital archival recordsthe desire to make digital archival records available for computational analysis As we touched upon in our recent blog post, we now need a model that describes our records as data.
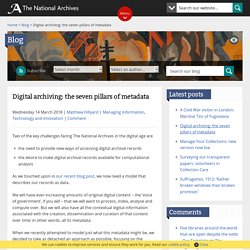
We will have ever-increasing amounts of original digital content – the ‘voice of government’, if you will – that we will want to process, index, analyse and compute over. But we will also have all the contextual digital information associated with the creation, dissemination and curation of that content over time: in other words, all its metadata. When we recently attempted to model just what this metadata might be, we decided to take as detached an approach as possible, focusing on the characteristics and provenance of the metadata, rather than the perhaps-more-usual approach of categorising the metadata by its function.
Mapping and quantifying political information warfare – SHARE LAB. This is the second part of our story about information warfare. for first part, please read Initial concept of internet and its architecture promised us a decentralised and democratic possibility where every person is a medium.
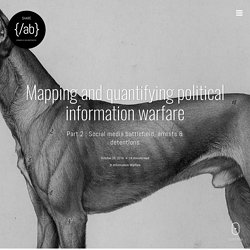
But 50 years later, not a lot of this dream is left. In reality, infrastructure and services became highly centralised, controlled by the internet service providers and gigantic internet companies such as Google or Facebook for example. Yes, we still have a chance to be the media, but in most cases only within the bigger social and media structures, owned and controlled by someone else. But still, even in this case it is much more harder for governments or political actors to have control over media than 20 years ago, when nodes that they needed to control were highly centralised around just a few national TV stations and newspapers.
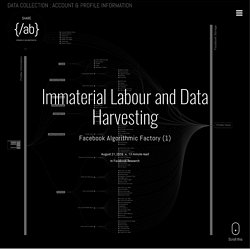
Human Data Banks and Algorithmic Labour. This is the second story in our investigation trilogy titled Facebook Algorithmic Factory, created with the intention to map and visualise a complex and invisible exploitation process hidden behind a black box of the World’s largest social network.
The three stories are exploring four main segments of the process: Data collection – Immaterial Labour and Data harvestingStorage and Algorithmic processing – Human Data Banks and Algorithmic LabourTargeting – Quantified lives on discount The following map is one of the final results of our investigation, but it can also be used as a guide through our stories, and practically help the reader to remain in the right direction and not to get lost in the complex maze of the Facebook Algorithmic Factory.
In his famous ”Postscript on the Societies of Control” Deleuze envisions a form of power that is no longer based on the production of individuals but on the modulation of dividuals. 17th century engraving of the pons asinorum in logic. D3.js - Data-Driven Documents. D3.js - Data-Driven Documents. Gallery · d3/d3 Wiki.
Wiki ▸ Gallery Welcome to the D3 gallery!

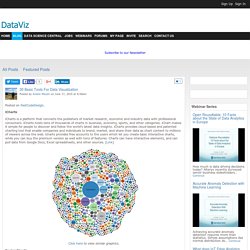
30 Basic Tools For Data Visualization. Posted on FastCodeDesign. iCharts iCharts is a platform that connects the publishers of market research, economic and industry data with professional consumers. iCharts hosts tens of thousands of charts in business, economy, sports, and other categories. iChart makes it simple for people to discover and follow the world’s latest data insights. iCharts provides cloud-based and patented charting tool that enable companies and individuals to brand, market, and share their data as chart content to millions of viewers across the web. icharts provides free accounts to the users which let you create basic interactive charts, while you can buy the premium version as well with tons of features.
8 tools for visualizing data with open source. Data visualization is the mechanism of taking tabular or spatial data and conveying it in a human-friendly and visual way.
There are several open source tools that can help you create useful, informative graphs. In this post we will take a look at eight open source, data visualization tools. Musique on Pinterest. Amazon lance un premier supermarché sans caisse aux États-Unis. Le géant du e-commerce a ouvert à Seattle son premier magasin alimentaire.
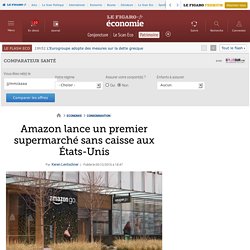
Sa particularité : il n'a pas de caisse. On y fait ses courses sans payer. Amazon a utilisé les mêmes technologies que celles de la voiture autonome. Un magasin sans caisse. Où l'on ne débourse pas un centime sur place. En révélant ce lundi le profil de son magasin dans une vidéo postée sur Twitter, Amazon a créé une vraie révolution dans le commerce alimentaire. La vidéo de présentation d'Amazon Go: Outre l'absence de caisses, Amazon a choisi un format à taille humaine pour son premier espace, 170 m2. The Data Visualisation Catalogue. Immaterial Labour and Data Harvesting. This is the first story in our investigation trilogy titled Facebook Algorithmic Factory, created with the intention to map and visualise a complex and invisible exploitation process hidden behind a black box of the World’s largest social network.
The three stories are exploring four main segments of the process: Data collection – Immaterial Labour and Data harvestingStorage and Algorithmic processing – Human Data Banks and Algorithmic LabourTargeting – Quantified lives on discount The following map is one of the final results of our investigation, but it can also be used as a guide through our stories, and practically help the reader to remain in the right direction and not to get lost in the complex maze of the Facebook Algorithmic Factory. With 1.6 billion active users in 2015, Facebook is heading towards fulfilling their mission to connect every person on this planet through their social network. Those are the raw resources exploited within Facebook Factory.
A.Within Facebook. Sans titre. Lev Manovich. The Database Logic After the novel, and subsequently cinema privileged narrative as the key form of cultural expression of the modern age, the computer age introduces its correlate - database. Many new media objects do not tell stories; they don't have beginning or end; in fact, they don't have any development, thematically, formally or otherwise which would organize their elements into a sequence. Instead, they are collections of individual items, where every item has the same significance as any other. Why does new media favor database form over others? Can we explain its popularity by analyzing the specificity of the digital medium and of computer programming? Rue89.nouvelobs. Moscou, 27 mai 2011. Le grand ciel lumineux de cette fin de printemps est trompeur, la soirée s’annonce encore glaciale. À l’est de la ville, une foule dense commence à s’agglutiner au pied du stade du Lokomotiv, l’un des grands clubs de football de la capitale russe.
C’est soir de match à Moscou. Le Lokomotiv s’apprête à recevoir le FK Anji Makhatchkala, une équipe venue du lointain Daghestan. Flightradar24. Comment l’affaire Google Books se termine en victoire pour le Text Mining. Google a lancé son projet géant de numérisation des livres en 2004 et dès l’année suivante, un ensemble d’auteurs et d’éditeurs ont attaqué le moteur de recherche devant les tribunaux pour violation du droit d’auteur.
CNIL CAHIERS IP2 WEB. Dominique Cardon : "Comprendre les algorithmes pour en tirer parti" Les-Data-Management-Platforms-DMP. Bien plus qu’un simple bon. Publishing%20in%20the%20Era%20of%20Big%20Data%20-%20Kobo%20Whitepaper%20Fall%202014.pdf. Sportifs connectés : champions et amateurs sous haute-surveillance. « Les données, c’est comme le vin, il faut savoir les stocker au bon endroit, et elles prennent de la valeur avec le temps.
Mais contrairement au vin dont il ne reste rien une fois que vous avez ouvert la bouteille et bu, les données, elles, elles restent. » Roberto Siagri (Eurotech). Book. The Cathedral of Computation. Algorithms are everywhere, supposedly. Dear Data. Information aesthetics - Data Visualization & Information Design. Event Processing. Why store data to find out what happened or what could have been when you can act on events as they occur? TIBCO's event-driven solutions allow you to capture, aggregate, and analyze real-time and historical data of any variety, volume, and velocity to gain contextual awareness and act preemptively. Anticipate Monitor and leverage fast-moving, real-time event streams from devices, logs, and applications to gain contextual awareness and seize opportunities or reduce risks the moment you sense them.
Our event processing solutions identify patterns as they unfold and help you leverage the insights you've developed through experience. Make better decisions faster. David M. Andrzejewski. Strata-2015-slides.pdf. Big Data Conference - Strata + Hadoop World, February 17 - 20, 2015, San Jose, CA. What previous attendees have said I learned more about big data in just three days attending Strata than in one year doing research on my own.
One of the most valuable events to advance my career. This is probably the pinnacle of Big Data conferences to attend for networking and getting the latest updates on ground breaking new technologies in the Big Data space. See the Agenda Strata + Hadoop World brings together the best minds in strategy, science, and industry for the defining event of the data industry. The depth and breadth of what's covered requires 10 different tracks just to organize it all. Data analysis and commentary: O'Reilly Radar. An alternate perspective on data-driven decision making The O'Reilly Radar Podcast: Tricia Wang on "thick data," purpose-driven problem solving, and building the ideal team.