
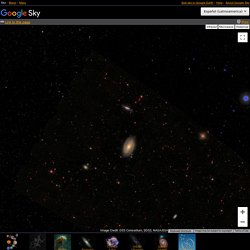
Google Earth kmz links/files. Kmlfactbook.org. Google Earth Community - Forums powered by UBB.threads™ Archaeological Atlas Project. Sky. ©2017 Google - Terms of Use Image Credit: DSS Consortium, SDSS, NASA/ESA.
Earth Knowledge. Metavers. Immersive Cocoon. INOVE Space Models. Planetarium - Interactive star map and virtual sky. Top Five Virtual Sky Simulators. Who has not been dazzled and intrigued when lifting his gaze to the celestial vault on a clear, dark night?
The spectacle of those fleeting and distant lights racks both our eyes and our brains. Is this star farther away than that one, or is it simply less luminous? Is that little blot, barely visible over there, a nebula, a star cluster or a galaxy? These free software programs: Stellarium, Celestia, WinStars, Open Universe and StarCalc, will let you leave this imperfect Earth for a moment and … dream. Start exploring. Stellarium – Current version: 0.9.0 One of the most beautiful astronomy software, Stellarium is a free open source planetarium for your computer.
It is being used in planetarium projectors. Celestia – Current version: 1.4.1 The free space simulation that lets you explore our universe in three dimensions. Unlike most planetarium software, Celestia doesn’t confine you to the surface of the Earth. WinStars – Current version: 2.077 R1 OpenUniverse – Current version: Beta 3. Partiview. Documentation | Uses | Binaries | Source Code | GeoWalls & Domes | Publications | Licensing | Mailing List | Misc. | Links Partiview is free, open-source software from the National Center for Supercomputing Applications (NCSA) at the University of Illinois Urbana-Champaign.
It is an industrial strength, interactive, mono- or stereoscopic viewer for 4-dimensional datasets. It is written in C++/OpenGL and has been compiled to run on Linux, Windows, OS X, and Irix. Stellarium. Examining how internet mapping tools like Google Earth affect science and society.
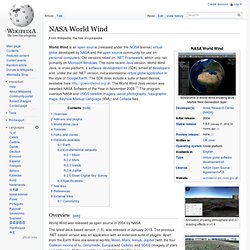
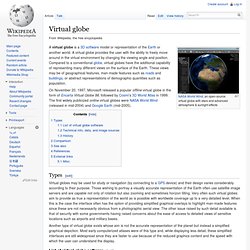
Dapple Earth Explorer: Map and View the Earth. NASA World Wind. Animation showing atmosphere and shading effects in v1.4 USGS Urban Ortho-Imagery of Huntington Beach, California in older version of World Wind (1.2) A cyclone moving across the Indian Ocean (on normal cloud cover - not Rapid Fire MODIS) Washington DC, Wikipedia point layer - icons link to Wikipedia articles Overview[edit] World Wind was released as open source in 2004 by NASA.
Users could interact with the selected planet by rotating it, tilting the view, and zooming in and out. Other features of World Wind.NET included support for .X (DirectX 3D polygon mesh) models and advanced visual effects such as atmospheric scattering or sun shading. The resolution inside the US is high enough to clearly discern individual buildings, houses, cars (USGS Digital Ortho layer) and even the shadows of people (metropolitan areas in USGS Urban Ortho layer).
Microsoft has allowed World Wind to incorporate Virtual Earth high resolution data for non-commercial use.[2] Add-ons and plugins[edit] Tutorials[edit] Age. Main Page - World Wind Wiki. All World Wind resources in one place. Pavel Risenberg. Nooblast Project inspired by the old days Noösphere concept.
Visualization picks the real-time data from public APIs and calculates overall strength of signal (recent network buzz) for two given keywords. Some picked events have geolocation information, so they mapped on the globe in the exact points. The overall strength visualized around the globe as “noo”-cloud, the size of which reflects event streams and shaped by geotagged data, building light abstract visual structures-snapshots in space for each term.
It explores abstract visual component of generated crowd sourced info streams as the visual connection attaching you to the pulse of planet. Pavel Risenberg. Visual Idea.
Globes virtuels, images satellites. WebGL Globe. Visualizing geographic data with the WebGL Globe. By Doug Fritz of the Google Data Arts Team Today we're sharing a new Chrome Experiment called the WebGL Globe.
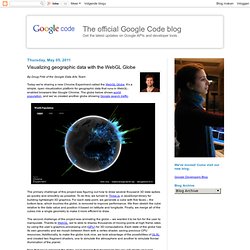
It’s a simple, open visualization platform for geographic data that runs in WebGL-enabled browsers like Google Chrome. The globe below shows world population, and we’ve created another globe showing Google search traffic. The primary challenge of this project was figuring out how to draw several thousand 3D data spikes as quickly and smoothly as possible. To do this, we turned to Three.js, a JavaScript library for building lightweight 3D graphics. Google Search Globe. Virtual globe. NASA World Wind, an open-source virtual globe with stars and advanced atmosphere & sunlight effects A virtual globe is a 3D software model or representation of the Earth or another world.
A virtual globe provides the user with the ability to freely move around in the virtual environment by changing the viewing angle and position. Compared to a conventional globe, virtual globes have the additional capability of representing many different views on the surface of the Earth. These views may be of geographical features, man-made features such as roads and buildings, or abstract representations of demographic quantities such as population. On November 20, 1997, Microsoft released a popular offline virtual globe in the form of Encarta Virtual Globe 98, followed by Cosmi's 3D World Atlas in 1999. Types[edit] Arty and Educational Globes. Read About the Erdapfel at Welt.de In order to create a round globe, we first had to believe that the world was indeed round.

The Greek were one of the first civilizations to use spherical depictions of the world although many cultures believed the earth was flat for centuries after the Greek's discovery. Virtual Globes. Introduction to Virtual Globes. Outerra.