
Visualization Tools, Datasets, and Resources – April 2020 Roundup. Every month, I collect visualization tools and resources that might help you make better charts.
Here’s the good stuff for April. To access this issue of The Process, you must be a member. (If you are already a member, log in here.) The Process is a weekly newsletter where I evaluate how visualization tools, rules, and guidelines work in practice. I publish every Thursday. Over 100 Incredible Infographic Tools and Resources (Categorized) - DailyTekk. This post is #6 in DailyTekk’s famous Top 100 series which explores the best startups, gadgets, apps, websites and services in a given category.

Total items listed: 112. Time to compile: 8+ hours. Follow @DailyTekk on Twitter to make sure you don’t miss a week! Update: Be sure to check out our latest post on infographics: Infographics Are Everywhere – Here’s How to Make Yours Go Viral. I love a good infographic! Software Tools. Open Source Licenses Non-Commercial Binary Licenses Non-Commercial Source Licenses You are welcome to download and use the software tools appearing on this page that have been developed by AT&T Labs researchers.
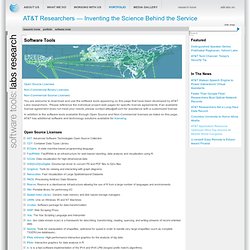
Please reference the individual project web pages for specific license agreements. If an available license agreement does not meet your needs, please contact attip@att.com for assistance with a customized license. Datavisualization.ch Selected Tools. A Carefully Selected List of Recommended Tools on Datavisualization. When I meet with people and talk about our work, I get asked a lot what technology we use to create interactive and dynamic data visualizations.
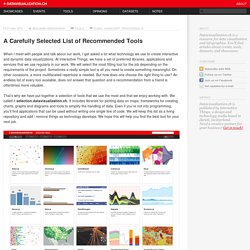
At Interactive Things, we have a set of preferred libraries, applications and services that we use regularly in our work. We will select the most fitting tool for the job depending on the requirements of the project. Sometimes a really simple tool is all you need to create something meaningful. On other occasions, a more multifaceted repertoire is needed. But how does one choose the right thing to use? That’s why we have put together a selection of tools that we use the most and that we enjoy working with. Let me answer the most likely questions right away: No, not everything find its’ way into this list, so you might not find your personal favorite. Data Visualization: 20+ Useful Tools and Resources. There are plenty of cool technologies available to collect and examine data.
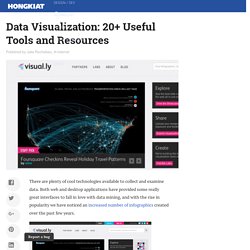
Both web and desktop applications have provided some really great interfaces to fall in love with data mining, and with the rise in popularity we have noticed an increased number of infographics created over the past few years. Today we’ll be looking into some really cool and popular online resources for data visualization. You can see all kinds of data like human population, world condition and even human emotion presented via the visualization. While some of the visualization might be experimental, all of them have one similarity: they help you understand the data better, and this is exactly what visualization is for.
If you’ve designed your own infographic or visualization tool we’d love to check it out. Recommended Reading: More Infographic related posts. Better World Flux Now this is one beautiful visualization tool! The refined condition of BWF’s design comes as no surprise. Visual.ly We Feel Fine RSS Voyage. 22 free tools for data visualization and analysis. You may not think you've got much in common with an investigative journalist or an academic medical researcher.
But if you're trying to extract useful information from an ever-increasing inflow of data, you'll likely find visualization useful -- whether it's to show patterns or trends with graphics instead of mountains of text, or to try to explain complex issues to a nontechnical audience. There are many tools around to help turn data into graphics, but they can carry hefty price tags. The cost can make sense for professionals whose primary job is to find meaning in mountains of information, but you might not be able to justify such an expense if you or your users only need a graphics application from time to time, or if your budget for new tools is somewhat limited.
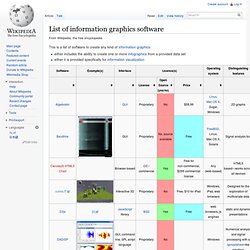
If one of the higher-priced options is out of your reach, there are a surprising number of highly robust tools for data visualization and analysis that are available at no charge. List of information graphics software. This is a list of software to create any kind of information graphics: either includes the ability to create one or more infographics from a provided data seteither it is provided specifically for information visualization Vector graphics[edit] Vector graphics software can be used for manual graphing or for editing the output of another program.
Please see: See also[edit] References[edit] Jump up ^ "Homepage". Free Data Visualization and Analysis Tools. What it does: Google Refine can be described as a spreadsheet on steroids for taking a first look at both text and numerical data.
Like Excel, it can import and export data in a number of formats including tab- and comma-separate text files and Excel, XML and JSON files. Refine features several built-in algorithms that find text items that are spelled differently but actually should be grouped together. After importing your data, you simply select edit cells --> cluster and edit and select which algorithm you want to use. After Refine runs, you decide whether to accept or reject each suggestion.
For example, you could say yes to combining Microsoft and Microsoft Corp., but no to combining Coach Inc. with CQG Inc. There are also numerical options that offer quick and easy overviews of data distributions. Beyond data housekeeping, Google Refine offers some useful analysis tools, such as sorting and filtering.
Skill level: Advanced beginner. Statistical analysis Google Fusion Tables Impure.