
Data Visualization Demo. Many Eyes. Quadrigram. Dependency Graph. This visualization shows the dependencies among classes within the Flare library.
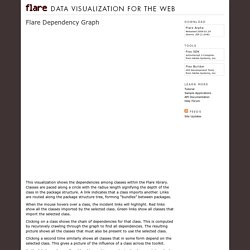
Classes are paced along a circle with the radius length signifying the depth of the class in the package structure. A link indicates that a class imports another. Links are routed along the package structure tree, forming “bundles” between packages. When the mouse hovers over a class, the incident links will highlight. Arbor.js. Gallery · mbostock/d3 Wiki. Wiki ▸ Gallery Welcome to the D3 gallery!

More examples are available for forking on Observable; see D3’s profile and the visualization collection. Please share your work on Observable, or tweet us a link! Visual Index Basic Charts. Datavisualization.ch Selected Tools. Excel Speedometer chart template. Posted on September 9th, 2008 in Charts and Graphs , hacks , Learn Excel - 91 comments Gauges are a familiar metaphor, everyone can understand them, you can see them everywhere – near your stove, ac, car, gaming console, pc – you name it.
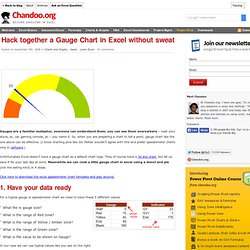
So, when you are preparing a chart to tell a point, gauge chart like the one above can be effective. EDraw Mindmap. Gapminder: Unveiling the beauty of statistics for a fact based world view.