
"I feel the need... the need for SPEED!" [Seven simple, performance-boosting tweaks for common Silverlight/WPF Charting scenarios] - Delay's Blog. No matter how fast things are, they never seem to be fast enough.
!["I feel the need... the need for SPEED!" [Seven simple, performance-boosting tweaks for common Silverlight/WPF Charting scenarios] - Delay's Blog](http://cdn.pearltrees.com/s/pic/th/performance-silverlight-39508560)
Even if we had the world's most optimized code in the Silverlight/WPF Data Visualization assembly, I bet there would still be a couple of people who wanted better performance. Unfortunately, we have don't have the world's most optimized code, and performance concerns represent one of the most common customer issues with Charting. While I wish we had the resources to commit to a few weeks of focused performance work, things just haven't panned out like that so far. Instead, I've got the next best thing: a collection of simple changes anyone can make to noticeably improve the performance of common scenarios with today's bits! To demonstrate the impact of each of these tips, I've created a new "Performance Tweaks" tab in my DataVisualizationDemos sample application. For each of the seven tips below, I list simple steps that show the performance benefit of the tip using the new sample page. Samples Environment for Microsoft Chart Controls.
You can now download Visual Studio 2010 projects that contain all the samples targeting .NET Framework 4.The samples environment for Microsoft Chart Controls for .NET Framework contains over 200 samples for both ASP.NET and Windows Forms.
The samples cover every major feature in Chart Controls for .NET Framework. They enable you to see the Chart controls in action as well as use the code as templates for your own web and windows applications. The samples environments each contains a Getting Started section to help you start using the Chart controls quickly. The samples demonstrates how to use the following features in Microsoft Chart Controls for .NET Framework: Chart Controls. The Chart controls enable you to create ASP.NET pages or Windows Forms applications with simple, intuitive, and visually compelling charts for complex statistical or financial analysis.
The top 20 data visualisation tools. Bresenham's line algorithm. The Bresenham line algorithm is an algorithm which determines which points in an n-dimensional raster should be plotted in order to form a close approximation to a straight line between two given points.
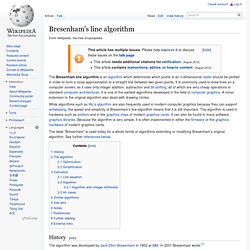
It is commonly used to draw lines on a computer screen, as it uses only integer addition, subtraction and bit shifting, all of which are very cheap operations in standard computer architectures. It is one of the earliest algorithms developed in the field of computer graphics. OpenWPFChart library. New tools for new science. Inspiration | Features | Download | People | Acknowledgements Easy visualization of scientific data: drag, drop, filter, slide, view, zoom, share DataSet Viewer is a simple standalone menu-driven tool for quickly exploring and comparing time series, geographic distributions and other patterns within scientific data.
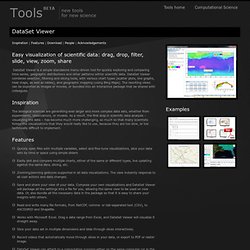
DataSet Viewer combines selection, filtering and slicing tools, with various chart types (scatter plots, line graphs, heat maps, as well as tables), and geographic mapping (using Bing Maps). The resulting views can be exported as images or movies, or bundled into an interactive package that be shared with colleagues. Inspiration The biological sciences are generating ever larger and more complex data sets, whether from experiments, observations, or models.
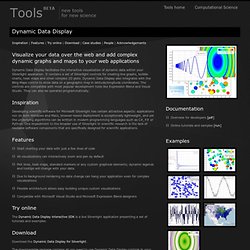
Features Download DataSet Viewer is part of The Scientific DataSet Library and Tools. OxyPlot. A WPF Pie Chart with Data Binding Support. Download source code - 26.9 KB Contents Introduction The Windows Presentation Framework provides developers with a toolset for developing visually rich and interactive user interfaces.
Charts are a highly effective way of presenting data to a user, with pie charts providing a simple mechanism for comparing the relative magnitudes of different items. WPF does not provide a charting library, and there is no ‘official’ library that can be purchased as an extension. For pie charts, CodeProject has a 3D pie chart library, elsewhere you can find a Silverlight pie chart. Dynamic Data Display. Tutorial: Creating Charts with Real-Time Data. This example implements a workflow that calculates a random walk and displays the generated values.
The calculation is run on a background thread, so the approach is suitable for more complicated calculations that take some time to complete. The example uses the FastLine chart type. Built-in Charting Controls (VS 2010 and .NET 4 Series) [In addition to blogging, I am also now using Twitter for quick updates and to share links.
Follow me at: twitter.com/scottgu] This is the fifteenth in a series of blog posts I’m doing on the upcoming VS 2010 and .NET 4 release. Today’s post covers a nice addition to ASP.NET and Windows Forms with .NET 4 - built-in charting control support. ASP.NET and Windows Forms Charting Controls. Www.dotnet-france.com/Documents/Win/35/Microsoft Chart Controls.pdf. Dynamic Data Display. New tools for new science. Inspiration | Features | Try online | Download | Case studies | People | Acknowlwdgements Visualize your data over the web and add complex dynamic graphs and maps to your web applications Dynamic Data Display facilitates the interactive visualization of dynamic data within your Silverlight application.
It contains a set of Silverlight controls for creating line graphs, bubble charts, heat maps and other complex 2D plots. Dynamic Data Display also integrates with the Bing Maps control to show data on a geographic map in latitude/longitude coordinates. The controls are compatible with most popular development tools like Expression Blend and Visual Studio. Inspiration Developing scientific software for Microsoft Silverlight has certain attractive aspects: applications run on both Windows and Macs, browser-based deployment is exceptionally lightweight, and yet the underlying algorithms can be written in modern programming languages such as C#, F# or Python. Features Try online Download. Foundations: Writing More Efficient ItemsControls. ExtremeUI - Line Charts with Data Templates.
Download the Code Sample Despite the many advanced manifestations of computer graphics these days (including animation and 3-D), I suspect that the most important will forever be the basic visual representation of data in traditional charts built from bars, pies and lines.
A table of data may appear like a jumble of random numbers, but any trends or interesting information hidden within the figures become much more comprehensible when displayed in a chart. With the Windows Presentation Foundation (WPF)—and its Web-based offshoot, Silverlight—we have discovered the advantages of defining graphical visuals in markup rather than code. Extensible Application Markup Language (XAML) is easier to alter than code, easier to experiment with and is more toolable than code, allowing us to define our visuals interactively and to play around with alternative approaches. Polyline Simplification. Table of Contents Introduction. Ramer–Douglas–Peucker algorithm. The Ramer–Douglas–Peucker algorithm (RDP) is an algorithm for reducing the number of points in a curve that is approximated by a series of points. The initial form of the algorithm was independently suggested in 1972 by Urs Ramer and 1973 by David Douglas and Thomas Peucker[1] and several others in the following decade.[2] This algorithm is also known under the names Douglas–Peucker algorithm, iterative end-point fit algorithm and split-and-merge algorithm.
Idea[edit] The purpose of the algorithm is, given a curve composed of line segments, to find a similar curve with fewer points. The algorithm defines 'dissimilar' based on the maximum distance between the original curve and the simplified curve. Memory Management for Large Data Sets - LabVIEW 2011 Help. LabVIEW automatically handles memory allocation. Since this process is automatic, LabVIEW must take precautions to handle the data safely. This means that LabVIEW copies data frequently. If the program deals with large sets of data, large and frequent data copies may lead to an out of memory error.
Use the following guidelines to avoid memory problems and optimize the program to handle large data sets. Reducing Copies of Large Data Sets. System.Windows.Media, espace de noms () High Performance WPF Silverlight Charts. Real-time Line charts with WPF and Dynamic Data Display.