
Visme : Create Interactive Online Presentations, infographics, animations & banners in HTML5. 5 outils pour créer vos propres infographies. Vous avez besoin de belles présentations ou infographies pour alimenter le contenu de votre site web ou de vos réseaux sociaux ?
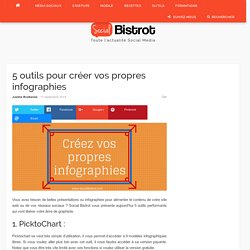
Social Bistrot vous présente aujourd’hui 5 outils performants qui vont libérer votre âme de graphiste. 1. PicktoChart : Picktochart se veut très simple d’utilisation, il vous permet d’accéder à 9 modèles infographiques libres. Si vous voulez aller plus loin avec cet outil, il vous faudra accéder à sa version payante. Comptez environ 29 € par mois ou 290 € par an. Accéder au site web de PicktoChart : 2. Visme est assez impressionnant et offre un vrai éventail de possibilités pour réaliser simplement une belle infographie. 20 d’entre elles sont libres de droit.
Visme vous propose en plus de la réalisation d’infographie des possibilités de créer des présentations, des bannières publicitaires et des démos produits. Pour bénéficier de l’accès Premium de Visme, vous pouvez compter 14 € environ. Accéder au site web : 3. Prix : indéterminé. 10 sites pour créer une infographie.
Les infographies permettent de visualiser plus facilement un ensemble de données parfois complexe. Une image est parfois plus parlante qu’un long discours ! Elles permettent de comprendre en un coup d’œil les principaux enseignements d’une étude quantitative par exemple. Certains utilisent également ce type de visualisation pour présenter leurs compétences au sein d’un CV original. De nombreux services existent pour réaliser facilement une infographie : nous en avons sélectionné dix. Réaliser une infographie en ligne Infogr.am Une référence, puisque l’outil a déjà permis de créer plus de 340 000 infographies ! Piktochart Ici aussi, il s’agit d’une référence : plus de 100 000 comptes ont été créés sur le site, vous pouvez donc utiliser le service les yeux fermés ! Easel.ly Il s’agit d’un outil très facile à prendre en main, qui permet de réaliser une infographie facilement. Une infographie représentant l’activité sur les réseaux sociaux What About Me Visual.ly Vizify Get About Me CV Gram Kinzaa.
Tips, tricks and resources to make your own gorgeous infographics. Infographics (or Information Graphics) are graphic visual representations of data or information, presented in a way to make it easier to consume information.
Infographics gained popularity in the mid-2000′s with the advent of sites like Digg and Reddit, and have quickly become one of the most popular methods to display researched data. There are three main types of infographics – where data is presented in a timeline, where statistical data is presented in graphs or with icons, or where data is presented on a map. In order to create an infographic which will be widely shared, think about your typography, colours, and layout. Make it easy for people to understand the information that’s being provided. Sometimes it’s best to keep things simple. Créer une infographie.
Data visualisation tools. A visual exploration on mapping complex networks. M.good. This month on GOOD.is, we are focusing on the topic of exploration—embracing the spirit of discovery and exploring areas near and far.
Whether you're a traveler on land, or you aspire to go to space, here is a round-up from our archive of our favorite GOOD infographics on exploration to inspire the inner Marco Polo in you. The Youth Movement: Where Do The Young and Educated Want to Migrate? If you would like to move permanently to another country, to which country would you like to move? From 2007 to 2010, Gallup posed this evocative question to people in 148 countries all over the world. To include an additional dimension, they compared young people aged 15 to 29 to educated adults' responses. A collaboration between GOOD and Column Five Media The United Bike Lanes of America When you think of a road trip across America, you probably envision zooming in a car along endless scenic highways and freeway overpasses. Funding the Final Frontier The last shuttle mission was in June 2011. Information aesthetics - Data Visualization & Information Design.
Data Visualizations, Challenges, Community. Infographics & Data Visualization. Information Is Beautiful. Data Visualization, Information Design and Infographics. Infographics. Infographic Creation Tools.