
SO stacked bar chart. SO stacked bar chart. Population Pyramid. Let’s Make a Bar Chart, III. In the previous parts of this tutorial we made a basic bar chart in HTML and then in SVG; now, we’ll improve the display by rotating the chart into columns and adding axes.
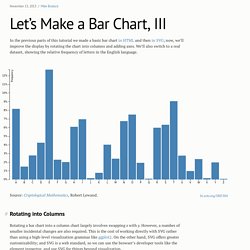
We’ll also switch to a real dataset, showing the relative frequency of letters in the English language. Source: Cryptological Mathematics, Robert Lewand. #Rotating into Columns Rotating a bar chart into a column chart largely involves swapping x with y. However, a number of smaller incidental changes are also required. When renaming the x scale to the y scale, the range becomes [height, 0] rather than [0, width]. We previously multiplied the var barHeight by the index of each data point (0, 1, 2, …) to produce fixed-height bars. Lastly, the bar labels must be positioned differently for columns rather than bars, centered just below the top of the column. #Encoding Ordinal Data Unlike quantitative values that can be compared numerically, subtracted or divided, ordinal values are compared by rank. #Preparing Margins. Towards Reusable Charts. I’d like to propose a convention for encapsulating reusable charts in D3.
Wait for it… function chart() { } A function; the standard unit of code reuse! #Configuration I jest; not any function will do. Function chart(width, height) { } Yet this is cumbersome for the caller: they must store the chart’s various arguments, and pass them whenever an update is needed. Function chart(config) { } However, the caller must then manage both the chart function (assuming you have multiple types of charts to pick from) and the configuration object. Function chart(config) { return function() { }; } Now, the caller need merely say: And subsequently, myChart() to update.
#Reconfiguration But what if you want to change the configuration after construction? Var myChart = chart(); myChart.width = 720; myChart.height = 80; The chart implementation changes slightly so that it can reference its configuration: function chart() { return function my() { }; } NVD3. D3 for Mere Mortals. By Luke Francl (look@recursion.org), August 2011 d3.js is a data visualization library by Mike Bostock, who is also the primary creator of Protovis, which D3 is designed to replace.
D3 has a steep learning curve, especially if (like me) you are not used to the pixel-precision of graphics programming. To build a visualization with D3, you need to understand JavaScript objects, functions, and the method-chaining paradigm of jQuery; the basics of SVG and CSS; D3's API; and the principles for designing effective infographics. The pay off is that you can create some amazing visualizations with D3 (just look at the examples!). I know very little about D3, but the best way to learn something is to teach it...so here is a very simple introduction to D3 from the beginning. D3.js Tips and Tricks: d3.js multi-line graph with automatic (interactive) legend. Multi-line graph with automatic legend and toggling show / hide lines.

Purpose Creating a multi-line graph is a pretty handy thing to be able to do and we worked through an example earlier in the book as an extension of our simple graph. In that example we used a csv file that had the data arranged with each lines values in a separate column. Simple column chart with D3.
Michael Bostock’s D3 is a brilliantly powerful visualization framework.
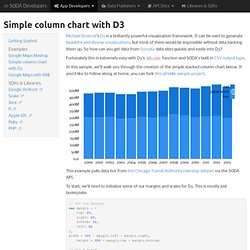
It can be used to generate beautiful and diverse visualizations, but most of them would be impossible without data backing them up. So how can you get data from Socrata data sites quickly and easily into D3? Fortunately this is extremely easy with D3’s d3.csv function and SODA’s built in CSV output type. In this sample, we’ll walk you through the creation of the simple stacked column chart below.
If you’d like to follow along at home, you can fork this jsFiddle sample project. This example pulls data live from this Chicago Transit Authority ridership dataset via the SODA API. To start, we’ll need to initialize some of our margins and scales for D3. Next we’ll create the SVG container that we’ll add our chart components to: Creating Multi-Series Charts in D3 — delimited. Authored by Steven Hall Making line charts or bar charts that have several different series of data can be challenging in D3.
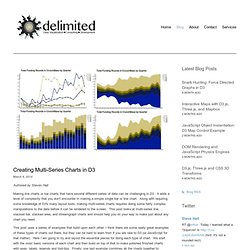
It adds a level of complexity that you don't encounter in making a simple single bar or line chart. Along with requiring some knowledge of D3's many layout tools, making multi-series charts requires doing some fairly complex manipulations to the data before it can be rendered to the screen. Making a bar chart. Last updated 2012 December 30 Now we’ll integrate everything we’ve learned so far to generate a simple bar chart with D3.
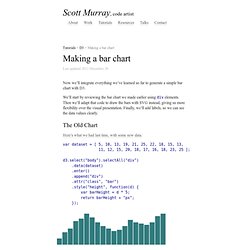
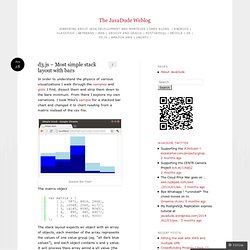
We’ll start by reviewing the bar chart we made earlier using div elements. Then we’ll adapt that code to draw the bars with SVG instead, giving us more flexibility over the visual presentation. Finally, we’ll add labels, so we can see the data values clearly. d3.js – Most simple stack layout with bars. <title>Simple Stack</title> svg { border: solid 1px #ccc; font: 10px sans-serif;
Stacked-to-Multiples. Grouped Bar Chart. Grouped Bar Chart This grouped bar chart is constructed from a CSV file storing the populations of different states by age group.
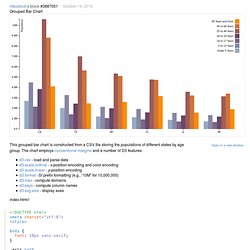
The chart employs conventional margins and a number of D3 features: d3.csv - load and parse datad3.scale.ordinal - x-position encoding and color encodingd3.scale.linear - y-position encodingd3.format - SI prefix formatting (e.g., “10M” for 10,000,000)d3.max - compute domainsd3.keys - compute column namesd3.svg.axis - display axes. Stacked Bar Chart. Hierarchical Bar Chart. DRY Bar Chart. Stacked Bar Chart. Generate D3 Bar Chart Source Code - D3.js Visualization Creator. Sortable Bar Chart. Stacked Bar Chart. DashBoard. Using d3-tip to add tooltips to a d3 bar chart.