
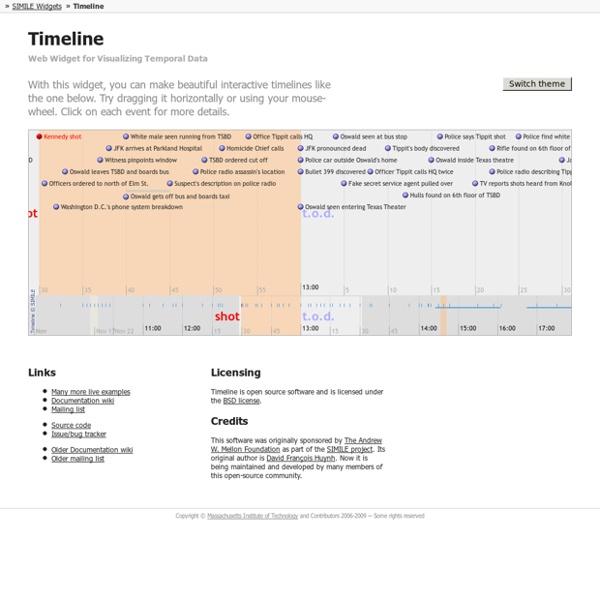
http://www.simile-widgets.org/timeline/
Related: Timeline tools and resources.List of timelines From Wikipedia, the free encyclopedia This is a list of timelines currently on Wikipedia. §Types[edit] §General timelines[edit] Data Wrangler UPDATE: The Stanford/Berkeley Wrangler research project is complete, and the software is no longer actively supported. Instead, we have started a commercial venture, Trifacta. For the most recent version of the tool, see the free Trifacta Wrangler.
Features - Qiqqa PDF Viewer The heart of Qiqqa, with all the features you’d expect from a regular PDF viewer, plus more tailored just for the serious researcher. Annotations, highlights, free form drawing Update to jQuery Visualize: Accessible Charts with HTML5 from Designing with Progressive Enhancement Posted by Maggie on 03/12/2010 A while ago, we came up with a technique for creating accessible charts and graphs that uses JavaScript to scrape data from an HTML table and generate bar, line, area, and pie chart visualizations using the HTML5 canvas element. This technique provides a simple way to generate charts, but more importantly, because it bases the chart on data already in the page in an HTML table element, it is accessible to people who browse the web with a screen reader or other assistive technology, or with browsers that don't fully support JavaScript or HTML5 Canvas. We packaged it as a downloadable jQuery plugin called Visualize. We've updated the Visualize plugin — adding ARIA attributes to clarify the chart's role to screen reader users, so they're better informed about which elements contain useful data; and providing two style variations to demonstrate how you can use CSS to customize the charts' appearance. How the Visualize plugin works
Graphics & Imaging - Quartz Composer Sprite Kit Sprite Kit is a powerful graphics framework for 2D games such as side-scrolling shooters, puzzle games, and platformers. A flexible API lets developers control sprite attributes such as position, size, rotation, gravity, and mass. Sprite Kit’s OpenGL-based renderer efficiently animates 2D scenes. Built-in support for physics makes animations look real, and particle systems create essential game effects such as fire, explosions, and smoke. To assist SpriteKit-based game development, Xcode supports texture atlas creation and includes a particle creator. Civil Rights Movement Timeline (14th Amendment, 1964 Act, Human Rights Law) Jan. 23 The 24th Amendment abolishes the poll tax, which originally had been instituted in 11 southern states after Reconstruction to make it difficult for poor blacks to vote. Summer The Council of Federated Organizations (COFO), a network of civil rights groups that includes CORE and SNCC, launches a massive effort to register black voters during what becomes known as the Freedom Summer. It also sends delegates to the Democratic National Convention to protest—and attempt to unseat—the official all-white Mississippi contingent. July 2
Protovis Protovis composes custom views of data with simple marks such as bars and dots. Unlike low-level graphics libraries that quickly become tedious for visualization, Protovis defines marks through dynamic properties that encode data, allowing inheritance, scales and layouts to simplify construction. Protovis is free and open-source, provided under the BSD License. It uses JavaScript and SVG for web-native visualizations; no plugin required (though you will need a modern web browser)!
Can anyone provide me a serial number for Adobe Acrobat XI pro? - Blurtit Acrobat XI is a powerful and well written piece of software used to read, view, and edit PDF files. I know you are looking for a serial number for Adobe Acrobat, but firstly, let's be honest: Adobe is not going to throw out free serial numbers, that would kill their business. If you run a Google search for "Acrobat XI Serial Numbers" you will get a bunch of spammy sites plastered in ads, often with fake downloads, sometimes infecting computers with spyware or malicious software. That is all you are going to get if you go down the freebie route with Adobe. What will actually help instead is looking for free Adobe Acrobat alternatives.
Data Visualization, Link Analysis, Social Network Analysis (SNA) Software: Sentinel Visualizer for Big Data Analysis Empowering the demanding needs of intelligence analysts, law enforcement, investigators, researchers, and information workers, Sentinel Visualizer is the next generation data visualization and analysis solution for your big data. With cutting edge features and best-of-breed usability, Sentinel Visualizer provides you with insight into patterns and trends hidden in your data. Its database driven data visualization platform lets you quickly see multi-level links among entities and model different relationship types.
5 + 5 vídeos de Internet de las Cosas « Symplio – Connecting atoms to the Internet The concept of Internet of Things is little known to many people because of its technical complexity involving connecting physical objects to the Internet. The idea of the devices connected to the web is create bidirectional data flows, resulting in smart products and services that make people lifestyle better and simpler. To better understand the concept of Internet of Things, their application, use and scope, we collect some of the best videos that explain how it works and we also include some products that are currently on the market. 1. “The Internet of Things” by IBM Media
Geologic time scale Online exhibits Geologic time scale Take a journey back through the history of the Earth — jump to a specific time period using the time scale below and examine ancient life, climates, and geography. You might wish to start in the Cenozoic Era (65.5 million years ago to the present) and work back through time, or start with Hadean time (4.6 to 4 billion years ago)* and journey forward to the present day — it's your choice. [Note: "mya" means "millions of years ago"] Toxiclibs.js - Open-Source Library for Computational Design There are several areas where toxiclibs.js stands apart to remain more idiomatic and helpful in the javascript environment. For a complete description of the conveniences added to toxiclibs.js, read the sugar file in the repository. Some examples of these differences are: loose-typed for working more naturally with javascript objects, no instanceof tests are ever usedtoxi.THREE.ToxiclibsSupport for easing work with Three.jstoxi.color.TColor additions for complete interoperability with CSS and X11 color names.toxi.geom.mesh.OBJWriter's getOutput() for getting OBJ contents back as a string (helpful in js environments that don't have file system access). Arrays / Collections The Java version frequently uses Collections, Iterators, and java-specific for-loops[2].
Shorthand "Stenography" redirects here. It is not to be confused with Steganography. Dutch stenography using the "System Groote" Shorthand is an abbreviated symbolic writing method that increases speed and brevity of writing as compared to a normal method of writing a language. The process of writing in shorthand is called stenography, from the Greek stenos (narrow) and graphē or graphie (writing). It has also been called brachygraphy, from Greek brachys (short) and tachygraphy, from Greek tachys (swift, speedy), depending on whether compression or speed of writing is the goal.