
Influx Datenbank sichern und wiederherstellen? @Sören Also ich mache mein Backup von der normalen Linux Kommandozeile aus und nicht unter der Influxdb-Konsole...
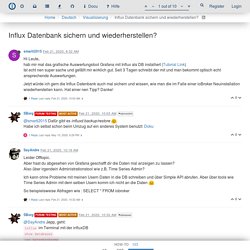
Das schaut dann so aus bei meiner Datenbank die iobroker heißt: Vorher muss aber die Influxdb.config bearbeitet werden. (48) How To Setup A Grafana Dashboard Step By Step. How to retrive more than 10k lines from InfluxDB using Pandas? Save DS18B20 Measurements to InfluxDB with Python. In this post i showed the basic setup of the DS18B20 sensor on Linux.
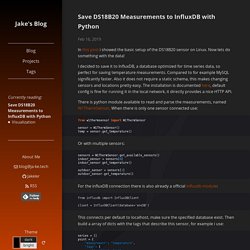
Now lets do something with the data! I decided to save it to InfluxDB, a database optimized for time series data, so perfect for saving temperature measurements. Compared to for example MySQL significantly faster. Also it does not require a static schema, this makes changing sensors and locations pretty easy. The installation is documented here, default config is fine for running it in the local network, it directly provides a nice HTTP API.
Matplotlib animations the easy way – Brushing Up Science. Creating animations with Python’s Matplotlib is quick and easy once you know how to do it.
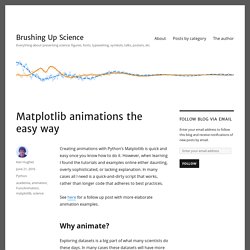
However, when learning I found the tutorials and examples online either daunting, overly sophisticated, or lacking explanation. In many cases all I need is a quick-and-dirty script that works, rather than longer code that adheres to best practices. See here for a follow up post with more elaborate animation examples. Vega Test. Index.html# bar.json#
Drawing animated GIFs with matplotlib - Eli Bendersky's website. This is a brief post on how to draw animated GIFs with Python using matplotlib.
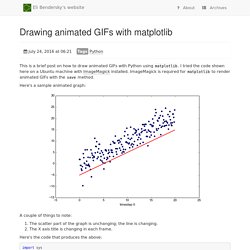
I tried the code shown here on a Ubuntu machine with ImageMagick installed. ImageMagick is required for matplotlib to render animated GIFs with the save method. Here's a sample animated graph: A couple of things to note: Animations with Matplotlib. Matplotlib’s animation base class deals with the animation part.

It provides a framework around which the animation functionality is built. There are two main interfaces to achieve that using: FuncAnimation makes an animation by repeatedly calling a function func. 让你用编程代码表白,要怎么写呢? 3D plot in python, space between x-ticks and the label - Intellipaat Community. Rotating a 3D plot — Matplotlib 2.2.3 documentation. Entfernen von Achsenrändern im 3D-Plot - Python, Matplotlib, Ränder, Achsen. Calculator/ at master · completejavascript/calculator. React.js Tutorial Deutsch - 5# Parent/Child Components & Conditional Rendering. How to Create React.js Components - Part 2. Using Interact — Jupyter Widgets 7.4.1 documentation. The interact function (ipywidgets.interact) automatically creates user interface (UI) controls for exploring code and data interactively.
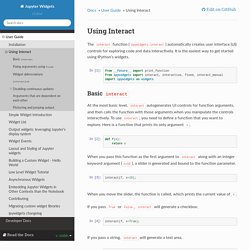
It is the easiest way to get started using IPython’s widgets. from __future__ import print_functionfrom ipywidgets import interact, interactive, fixed, interact_manualimport ipywidgets as widgets Basic interact¶ At the most basic level, interact autogenerates UI controls for function arguments, and then calls the function with those arguments when you manipulate the controls interactively. To use interact, you need to define a function that you want to explore. When you pass this function as the first argument to interact along with an integer keyword argument (x=10), a slider is generated and bound to the function parameter.
When you move the slider, the function is called, which prints the current value of x. If you pass True or False, interact will generate a checkbox: If you pass a string, interact will generate a text area. interact(f, x='Hi there! ') Python - Scipy Write Audio Issue. Exploring Beat Frequencies using the Audio Object — Jupyter Widgets 7.2.1 documentation. Using Interact — Jupyter Widgets 7.2.1 documentation. The interact function (ipywidgets.interact) automatically creates user interface (UI) controls for exploring code and data interactively. It is the easiest way to get started using IPython’s widgets. from __future__ import print_functionfrom ipywidgets import interact, interactive, fixed, interact_manualimport ipywidgets as widgets Basic interact¶ At the most basic level, interact autogenerates UI controls for function arguments, and then calls the function with those arguments when you manipulate the controls interactively.
To use interact, you need to define a function that you want to explore. When you pass this function as the first argument to interact along with an integer keyword argument (x=10), a slider is generated and bound to the function parameter. 3.5. 3D plotting with Mayavi — Scipy lecture notes. 3.5.3.1.
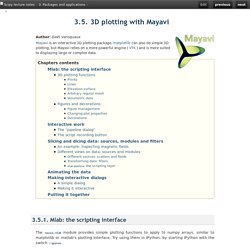
An example: inspecting magnetic fields Suppose we are simulating the magnetic field generated by Helmholtz coils. The examples/compute_field.py script does this computation and gives you a B array, that is (3 x n), where the first axis is the direction of the field (Bx, By, Bz), and the second axis the index number of the point. Arrays X, Y and Z give the positions of these data points. Demo text printing — Scipy lecture notes. Data-science-ipython-notebooks/README.md at master · donnemartin/data-science-ipython-notebooks. Serialization - Learn Python - Free Interactive Python Tutorial. Python provides built-in JSON libraries to encode and decode JSON.
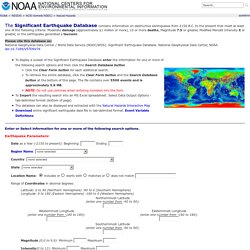
In Python 2.5, the simplejson module is used, whereas in Python 2.7, the json module is used. Since this interpreter uses Python 2.7, we'll be using json. In order to use the json module, it must first be imported: import json Session Inactive. Python Kugelflächenfunktionen spherical harmonics. Significant Earthquakes Database. Home | Contacts | Data | Disclaimers | Education | News | Privacy Policy | Site Map | Take Our Survey.
Removing An Axis Or Both Axes From A Matplotlib Plot. Sometimes, the frame around a matplotlib plot can detract from the information you are trying to convey. How do you remove the frame, ticks, or axes from a matplotlib plot? Matplotlib plot without a y axis The full example is available on github. First, we construct a figure and an axes object: The Axes object is a container that holds the axes, the ticks, the labels, the plot, the legend, etc. What is the python3 equivalent of "python -m SimpleHTTPServer" Debugging Python Code on the Raspberry Pi with Wing IDE - Wingware Python IDE. May 06, 2015 Wing IDE is an integrated development environment that can be used to develop and debug Python code running on the Raspberry Pi. Wing provides auto-completion, call tips, a powerful debugger, and many other features that help you write, navigate, and understand Python code.
Introduction The Raspberry Pi is not really capable of running Wing IDE itself, but you can set up Wing IDE on a computer connected to the Raspberry Pi to work on and debug Python code remotely. To do this, you will first need (1) a network connection between the Raspberry Pi and the computer where Wing IDE will be running, and (2) a way to share files between the two computers. The easiest way to connect the Raspberry Pi to your network is with ethernet, or see the instructions at the end of Using Wing IDE with Raspberry Pi for configuring a wifi connection. For file sharing, use Samba, or simply transfer a copy of your files to the Raspberry Pi using scp or rsync. Installing and Configuring the Debugger. Pythonic Perambulations. HowTo/Sorting. Original version by Andrew Dalke with a major update by Raymond Hettinger Python lists have a built-in sort() method that modifies the list in-place and a sorted() built-in function that builds a new sorted list from an iterable.
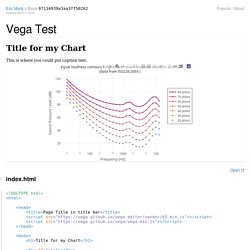
There are many ways to use them to sort data and there doesn't appear to be a single, central place in the various manuals describing them, so I'll do so here. Sorting Basics. Array computing and curve plotting. Visualizing a function f(x) is done by drawing the curve y=f(x) in an xy coordinate system. When we use a computer to do this task, we say that we plot the curve. Technically, we plot a curve by drawing straight lines between n points on the curve. Real-World Signals and Systems Case: Analog Filter Design with a Twist. You’re given the task of designing an analog (continuous-time) filter to meet the amplitude response specifications shown. You also need to find the filter step response, determine the value of the peak overshoot, and time where the peak overshoot occurs.
The objective of the filter design is for the frequency response magnitude in dB (20log10|H(f)|) to pass through the unshaded region of the figure as frequency increases. The design requirements reduce to the passband and stopband critical frequencies fp and fs Hz and the passband and stopband attenuation levels Ap and As dB. Additionally, the response characteristic is to be Butterworth, which means that the filter magnitude response and system function take this form: Here, N is the filter order, fc is the passband 3 dB cutoff frequency of the filter, and the poles, located on a semicircle is the left-half s-plane, are given by. December 2014. Python talk. Folien. Programmieren I 2015 - Python 3. Die Vorlesung findet jeden Mittwoch um 10:00 bis 11:30 Uhr im Raum 2-109. Vorlesung Kapitel 20 Einführung in NumPy und Matplotlib - Programmieren 1 - WS15/16.
Python. Numerisches Python: Matrix-Arithmetik in NumPy. Im vorigen Kapitel unserer Einführung in NumPy zeigten wir, wie man Arrays erzeugen und ändern kann. In diesem Kapitel wollen wir zeigen, wie wir in Python mittels NumPy ohne Aufwand und effizient Matrizen-Arithmetic betreiben können, also. Esci386 lesson19 misc. Numerical Python: Introduction into the Matplotlib Module of Python. Matplotlib Tutorial Introduction. Animated 3D plot - matplotlib plotting examples and tutorial. Motorblog » Die FFT mit Python einfach erklärt. Removing An Axis Or Both Axes From A Matplotlib Plot. 1.1. Scientific computing with tools and workflow — Scipy lecture notes.
Interactive work to test and understand algorithms: In this section, we describe an interactive workflow with IPython that is handy to explore and understand algorithms. PythonScientific simple. 5. Plotting Charts with Matplotlib - IPython Notebook Tutorial. Python 4: Mit Listen und Arrays arbeiten. Spyder Bis jetzt hast du (I)Python direkt in der Shell gestartet und dein Skripte in einem beliebigen Editor geschrieben.
Das ist die einfachste und flexibelste Möglichkeit mit Python zu arbeiten. Oft ist es aber praktischer mit einer IDE (Integrated Development Environment) zu arbeiten. Python With Spyder 2: Basic Arithmetic and Variable Assignment.