
PacktLib. There are several GUI libraries available, and one of the most famous is Qt.

In this book, we will use Qt 4, the latest major version of this library. Unless explicitly mentioned, when we write Qt, we are referring to Qt 4. We will follow the same progression as in the GTK+ chapter, and we will present the same examples, but this time written in Qt. We believe that this method will allow us to directly compare the libraries, and it has the advantage of not leaving the "How would I write something with library X? " question unanswered. We begin by giving an introduction to the library. Qt is a cross-platform application development framework, widely used for graphical programs (GUI) but also for non-GUI tools. Qt was developed by Trolltech (now owned by Nokia), and it's probably best known for being the foundation of the K Desktop Environment (KDE) for Linux.
The Qt toolkit is a collection of classes to simplify the creation of programs. Using Mayavi with scipy — mayavi v4.2.1 documentation. This tutorial example shows you how you can use Mayavi interactively to visualize numpy arrays while doing numerical work with scipy.
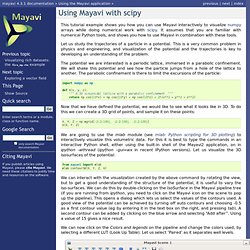
It assumes that you are familiar with numerical Python tools, and shows you how to use Mayavi in combination with these tools. Let us study the trajectories of a particle in a potential. This is a very common problem in physics and engineering, and visualization of the potential and the trajectories is key to developing an understanding of the problem. The potential we are interested is a periodic lattice, immersed in a parabolic confinement. We will shake this potential and see how the particle jumps from a hole of the lattice to another. Import numpy as np def V(x, y, z): """ A 3D sinusoidal lattice with a parabolic confinement. """ return np.cos(10*x) + np.cos(10*y) + np.cos(10*z) + 2*(x**2 + y**2 + z**2) Now that we have defined the potential, we would like to see what it looks like in 3D. Wx.DC. Glumpy - Fast OpenGL numpy visualization. Glumpy is a small python library for the rapid vizualization of numpy arrays, (mainly two dimensional) that has been designed with efficiency in mind.
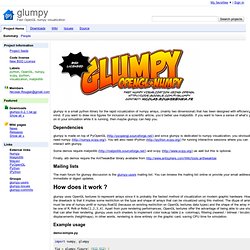
If you want to draw nice figures for inclusion in a scientific article, you’d better use matplotlib. If you want to have a sense of what’s going on in your simulation while it is running, then maybe glumpy can help you. Dependencies glumpy is made on top of PyOpenGL ( and since glumpy is dedicated to numpy visualization, you obviously need numpy ( You will also need IPython ( for running interactive sessions where you can interact with glumpy. Some demos require matplotlib ( and scipy ( as well but this is optional. Finally, atb demos require the AntTweakBar library available from Mailing lists The main forum for glumpy discussion is the glumpy-users mailing list. Glumpy uses OpenGL textures to represent arrays since it is probably the fastest method of visualization on modern graphic hardware.
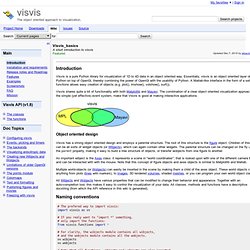
Example usage. Visvis_basics - visvis - A short introduction to visvis - The object oriented approach to visualization. Introduction.
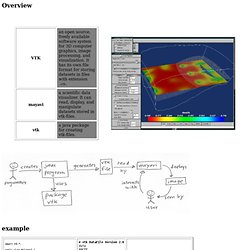
VTK - The Visualization Toolkit. Www.win.tue.nl/~wstahw/2Z860/college1/vtk.html. Overview example Datasets polygonal dataset structured dataset unstructured dataset.
Python 3D Software. A small collection (94 packages) of pointers to Python software for working in three dimensions "Open Source" of some type Batch converter from CAD files to Acrobat 3D-PDF Site is in German.
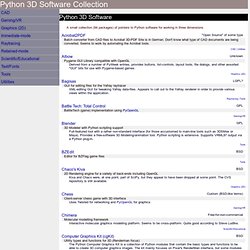
Don't know what type of CAD documents are being converted. Seems to work by automating the Acrobat tools. Unknown Pygame GUI Library compatible with OpenGL Derived from a number of PyWeek entries, provides buttons, list-controls, layout tools, file dialogs, and other assorted "GUI" bits for use with Pygame-based games. GUI for editing files for the Yafray raytracer. Axes. X : array_like, shape (n, m) or (n, m, 3) or (n, m, 4) Display the image in X to current axes.
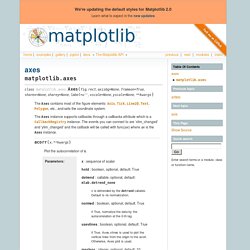
X may be a float array, a uint8 array or a PIL image. If X is an array, it can have the following shapes:MxN – luminance (grayscale, float array only)MxNx3 – RGB (float or uint8 array)MxNx4 – RGBA (float or uint8 array)The value for each component of MxNx3 and MxNx4 float arrays should be in the range 0.0 to 1.0; MxN float arrays may be normalised. cmap : Colormap, optional, default: None If None, default to rc image.cmap value. cmap is ignored when X has RGB(A) information aspect : [‘auto’ | ‘equal’ | scalar], optional, default: None If ‘auto’, changes the image aspect ratio to match that of the axes.If ‘equal’, and extent is None, changes the axes aspect ratio to match that of the image.
Interpolation : string, optional, default: None. Python - Matplotlib 3D Scatter Plot with Colorbar. Matplotlib: python plotting.