
Scipy Lecture Notes — Scipy lecture notes. Scikit-Learn Design Principles. Estimators represent the core interface in Scikit-Learn.

All learning algorithms, whether supervised or unsupervised, classification, regression, or clustering, implement the Estimator interface and expose a fit method. An Estimator’s fit method takes as input a (training) feature vector (“samples” or “predictors”) as well as (training) target labels (in the case of supervised learning), and in this way the estimator “learns” how to make predictions on unseen data (again, in the case of supervised learning).
A key design principle is that the instantiation of an Estimator (where, for example, you denote a model’s hyper-parameters) is decoupled from the learning process (where you fit the model with training data — your feature vectors, e.g., “X_train”; as well as your training labels/target variables, e.g., “Y_train”). Numpy axes explained - Sharp Sight. Effectively Using Matplotlib - Practical Business Python. Introduction The python visualization world can be a frustrating place for a new user.
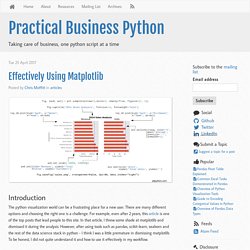
There are many different options and choosing the right one is a challenge. For example, even after 2 years, this article is one of the top posts that lead people to this site. From Python to Numpy. Introduction Problem vectorization is much harder than code vectorization because it means that you fundamentally have to rethink your problem in order to make it vectorizable.
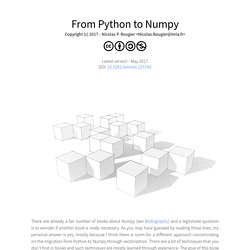
Most of the time this means you have to use a different algorithm to solve your problem or even worse... to invent a new one. The difficulty is thus to think out-of-the-box. To illustrate this, let's consider a simple problem where given two vectors X and Y, we want to compute the sum of X[i]*Y[j] for all pairs of indices i, j. Analyse de données en Python - notions avancées.
Nous avons vu dans l'article précédent que nous pouvons accéder aux colonnes du DataFrame grâce aux variables loc et iloc, en fournissant soit un index, soit le nom de la colonne.
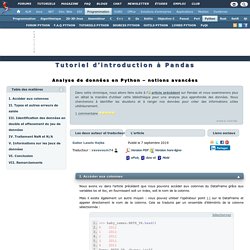
Mais il existe également un autre moyen : vous pouvez utiliser l’opérateur point (.) sur le DataFrame et appeler directement le nom de la colonne. Cela se traduira par un ensemble d’éléménts de la colonne sélectionnée : >>> baby_names.BRTH_YR.head() 0 20111 20112 20113 20114 2011 Name: BRTH_YR, dtype: int64 Il est parfaitement acceptable de s'en tenir à n'importe quelle approche. Parfois, j'utilise l'accès direct, d'autres fois, je tranche. C'est un sujet difficile à résoudre, car les fautes de frappe sont de petites erreurs que vous ne remarquez pas et il est difficile de trouver une solution automatisée pour les corriger.
Des valeurs plus longues ont été coupées dans certains cas. Un autre problème peut être que nous avons des noms dont toutes les lettres sont majuscules. Ce cas de figure est vraiment utile. Dataframe Visualization with Pandas Plot – Kanoki. Visualization has always been challenging task but with the advent of dataframe plot() function it is quite easy to create decent looking plots with your dataframe, The **plot** method on Series and DataFrame is just a simple wrapper around Matplotlib plt.plot() and you really don’t have to write those long matplotlib codes for plotting.
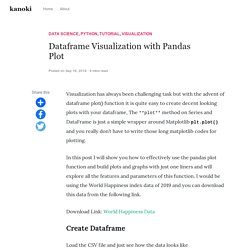
In this post I will show you how to effectively use the pandas plot function and build plots and graphs with just one liners and will explore all the features and parameters of this function. I would be using the World Happiness index data of 2019 and you can download this data from the following link. Download Link: World Happiness Data Create Dataframe. Python Libraries for Interpretable Machine Learning. Scipy Lecture Notes — Scipy lecture notes. A Visual Intro to NumPy and Data Representation – Jay Alammar – Visualizing machine learning one concept at a time.
The NumPy package is the workhorse of data analysis, machine learning, and scientific computing in the python ecosystem. It vastly simplifies manipulating and crunching vectors and matrices. In Python NumPy what is a dimension and axis? 3 Awesome Visualization Techniques for every dataset. Visualizations are awesome.
However, a good visualization is annoyingly hard to make. Moreover, it takes time and effort when it comes to present these visualizations to a bigger audience. We all know how to make Bar-Plots, Scatter Plots, and Histograms, yet we don’t pay much attention to beautify them. This hurts us - our credibility with peers and managers. You won’t feel it now, but it happens. Also, I find it essential to reuse my code. In this post, I am also going to talk about 3 cool visual tools: Categorical Correlation with Graphs,Pairplots,Swarmplots and Graph Annotations using Seaborn. In short, this post is about useful and presentable graphs. How to Version Control Jupyter Notebooks. An Introductory Example of Bayesian Optimization in Python with Hyperopt. 101 NumPy Exercises for Data Analysis (Python) - Machine Learning Plus. The goal of the numpy exercises is to serve as a reference as well as to get you to apply numpy beyond the basics.
The questions are of 4 levels of difficulties with L1 being the easiest to L4 being the hardest. If you want a quick refresher on numpy, the numpy basics and the advanced numpy tutorials might be what you are looking for. 1. Import numpy as np and see the version Difficulty Level: L1 Q. Show Solution. Python seaborn tutorial controlling figure aesthetics. Python Pandas: Tricks & Features You May Not Know. Pandas is a foundational library for analytics, data processing, and data science.

It’s a huge project with tons of optionality and depth. This tutorial will cover some lesser-used but idiomatic Pandas capabilities that lend your code better readability, versatility, and speed, à la the Buzzfeed listicle.