
How to Become a Google Search Jedi Master - #infographic. Search engines are the backbone of everyday internet use, but are you aware of the hidden tips and tricks available to improve your search?
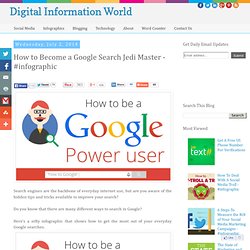
Do you know that there are many different ways to search in Google? Here's a nifty infographic that shows how to get the most out of your everyday Google searches. Key takeaways from visual: Google Search operators: If you are looking for an exact phrase/word, use quotation marks, for example: "top social media sites". If you want to get results from certain domains use site: command, e.g recipes site:pinterest.com. If you want to find pages whose title contains all words in the search, use allintitle: operator, e.g allintitle: best Google infographic. Aside from the examples above, Google doesn't usually recognize punctuation and grammar. however, punctuation and symbols that do work in Google search include:+ when searching for things such as blood type.@ when searching for social tags.# when searching for trending topics that use hashtags.
Chartle.net - interactive charts online! ChartsBin.com - Visualize your data. Piktochart- Infographic & Presentation Tool. Chartle.net - interactive charts online! ChartsBin.com - Visualize your data. Good Web Tools to Create Classroom Posters. Are you looking for tools to create classroom posters ?
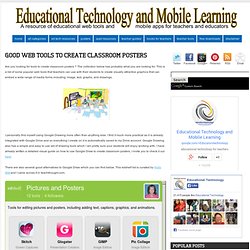
The collection below has probably what you are looking for. This is a list of some popular web tools that teachers can use with their students to create visually attractive graphics that can embed a wide range of media forms including: image, text, graphs, and drawings. I personally find myself using Google Drawing more often than anything else. I find it much more practical as it is already integrated with Google Drive and so everything I create on it is automatically saved to my Drive account. Google Drawing also has a simple and easy to use set of drawing tools which I am pretty sure your students will enjoy working with. How To Use Instagram In The Classroom. We’ve shared a lot of different ideas here on how to integrate different forms of social media in the classroom.
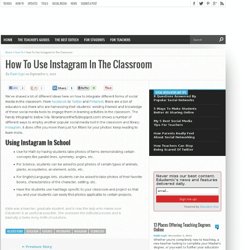
From Facebook to Twitter and Pinterest , there are a ton of educators out there who are harnessing their students’ existing interest and knowledge of these social media tools to engage them in learning activities in the classroom. The handy infographic below (Via: librariansonthefly.blogspot.com) shows a number of different ways to employ another popular social media tool in the classroom and library: Instagram . It does offer you more than just fun filters for your photos! Keep reading to learn more. Use for Math by having students take photos of items demonstrating certain concepts like parallel lines, symmetry, angles, etc. Katie was a teacher, graduate student, and is now the lady who makes sure Edudemic is as useful as possible. How To Use Instagram In The Classroom. #62 Easel.ly. This week we review the tool easel.ly Infographics represent data in a clear and creative way.
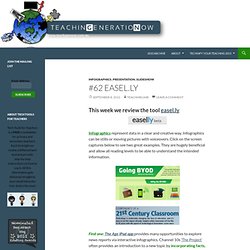
Infographics can be stills or moving pictures with voiceovers. Click on the screen captures below to see two great examples. They are hugely beneficial and allow all reading levels to be able to understand the intended information. Find one: The Age iPad app provides many opportunities to explore news reports via interactive infographics. Make your own: But if you or your students would like to make your own, easelly is the website for you. We like easelly because: it is freeyou can create your own infographicsit is web based and can be used on Mac/PCyou can embed the infographic on your blog or websiteit contains a range of themes ready to useit is easy to use How to : 1. Research – know your subject, find your data. Your information or alternatively do your own surveys for localised information. 2. easel.ly – log on and register.
20+ Tools to Create Your Own Infographics. A picture is worth a thousand words – based on this, infographics would carry hundreds of thousands of words, yet if you let a reader choose between a full-length 1000-word article and an infographic that needs a few scroll-downs, they’d probably prefer absorbing information straight from the infographic. What’s not to like? Colored charts and illustrations deliver connections better than tables and figures and as users spend time looking back and forth the full infographic, they stay on the site longer.
Piktochart. Here are 10 amazingly creative users of Instagram you could learn a thing or two from. Instagram has been a huge part of my daily life.
There are tons of great photographers out there who post stunning images on the app that get me really hooked, but what I find more amazing is the fact that some people out there have managed to use Instagram for their purposes in a way that goes beyond just photos of daily life (yes, I’m one of the guilty ones who only posts food, coffee and dog pictures). Instead, these people have used Instagram to either showcase a meaningful additional layer that exists parallel to what they do in real life outside of the app (this tends to apply to publications), or have used the photo service in a fun way to engage users (this tends to apply to marketers).
6 Hot Trends in Educational Technology [#Infographic] Infographics & Data Visualization. Use Maps in Your Infogr.am Infographics. Create and share visual ideas online.